Kubecost: Cross Charging Costs of Data Processing Pipelines in Data Mesh Architecture
Introduction As organizations increasingly adopt cloud-native technologies like Kubernetes, managing costs becomes a growing concern. With multiple…
Read moreInterested in joining the data analytics world? Not sure where to start? Are more and more questions popping into your head? I’ve been there myself and I’ve learned some lessons the hard way. I’m sharing my experience to hopefully spare you a headache :)
You probably have some idea about what Analysts do. Roughly speaking, their job is to solve business problems using data. But the world of analytics is not static. It has evolved rapidly in recent years. More and more people deal with data as part of their daily job. As a result, there is a lot of variety when it comes to skills and responsibilities in data-related roles. If you randomly pick two Analysts, their day to day duties may be entirely different. After spending some time inside the field, I’ve noticed that two exceptionally contrasting profiles stand out. You can try to distinguish between them by looking at the tools used by each of them on a daily basis.
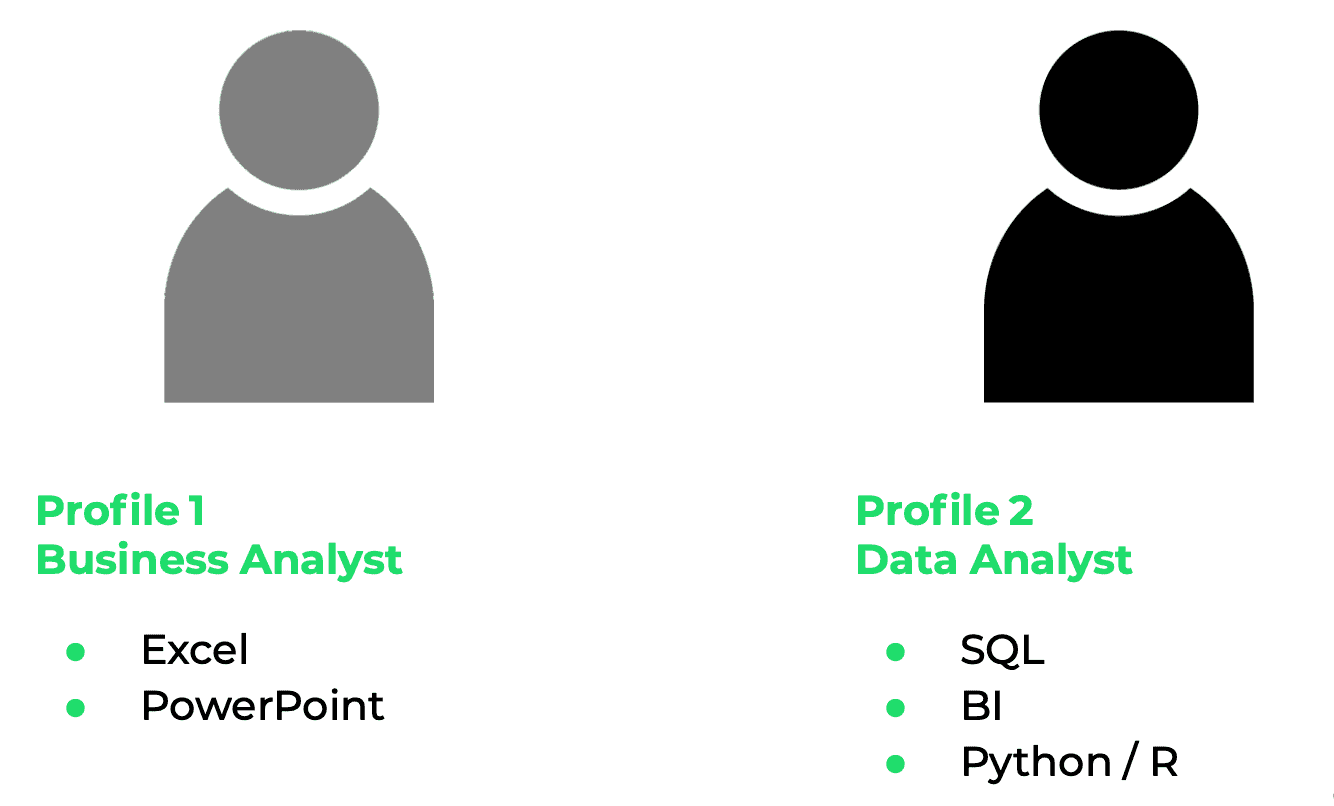
“Profile 1” Analysts mostly utilize spreadsheets and presentations to generate and deliver insights. These people are usually close to the business and rely heavily on their domain knowledge. The tools they use are well known and understood by business users, though quite limited when it comes to scalability. For better clarity, we’ll call this profile a “Business Analyst”.
On the contrary, the second type of Analysts have a wider array of technical tools at their disposal. They are capable of automating data workflows and scaling up their work. Let’s call them “Data Analysts”. It’s definitely not a principle, but some Data Analysts that I’ve met were relatively distant from the business. Being part of tech teams, they relied heavily on domain knowledge of more business-oriented groups.
Both Business Analysts and Data Analysts can deliver great value for the company. Both are able to apply business knowledge to deliver data products. The real difference is in the way their work scales.
For a Business Analyst, at some point the only way to deliver more value is to squeeze more working hours into a day. That’s because maintaining reports created in spreadsheets is time consuming (even after applying some smart hacks). The paradox is that the more successful you are at generating high-quality data products, the less time you have to do it. Working harder also has its limitations as you only have 24 hours in a day. There is a point that you can’t pass no matter what you do.
I’d argue that no matter what your current profile is, adding more technical skills to your portfolio is definitely worth pursuing for very pragmatic reasons. The knowledge and experience that you’ve gained over the years has strong leverage in this case. Adding more technical skills to your portfolio is probably the closest you can get to cloning yourself. It allows you to produce more in the same amount of time.
A person with a Data Analyst skill set also has to maintain his products. The difference is that the cost is much lower for a solution of a similar complexity. It may be even neglectable in some cases.
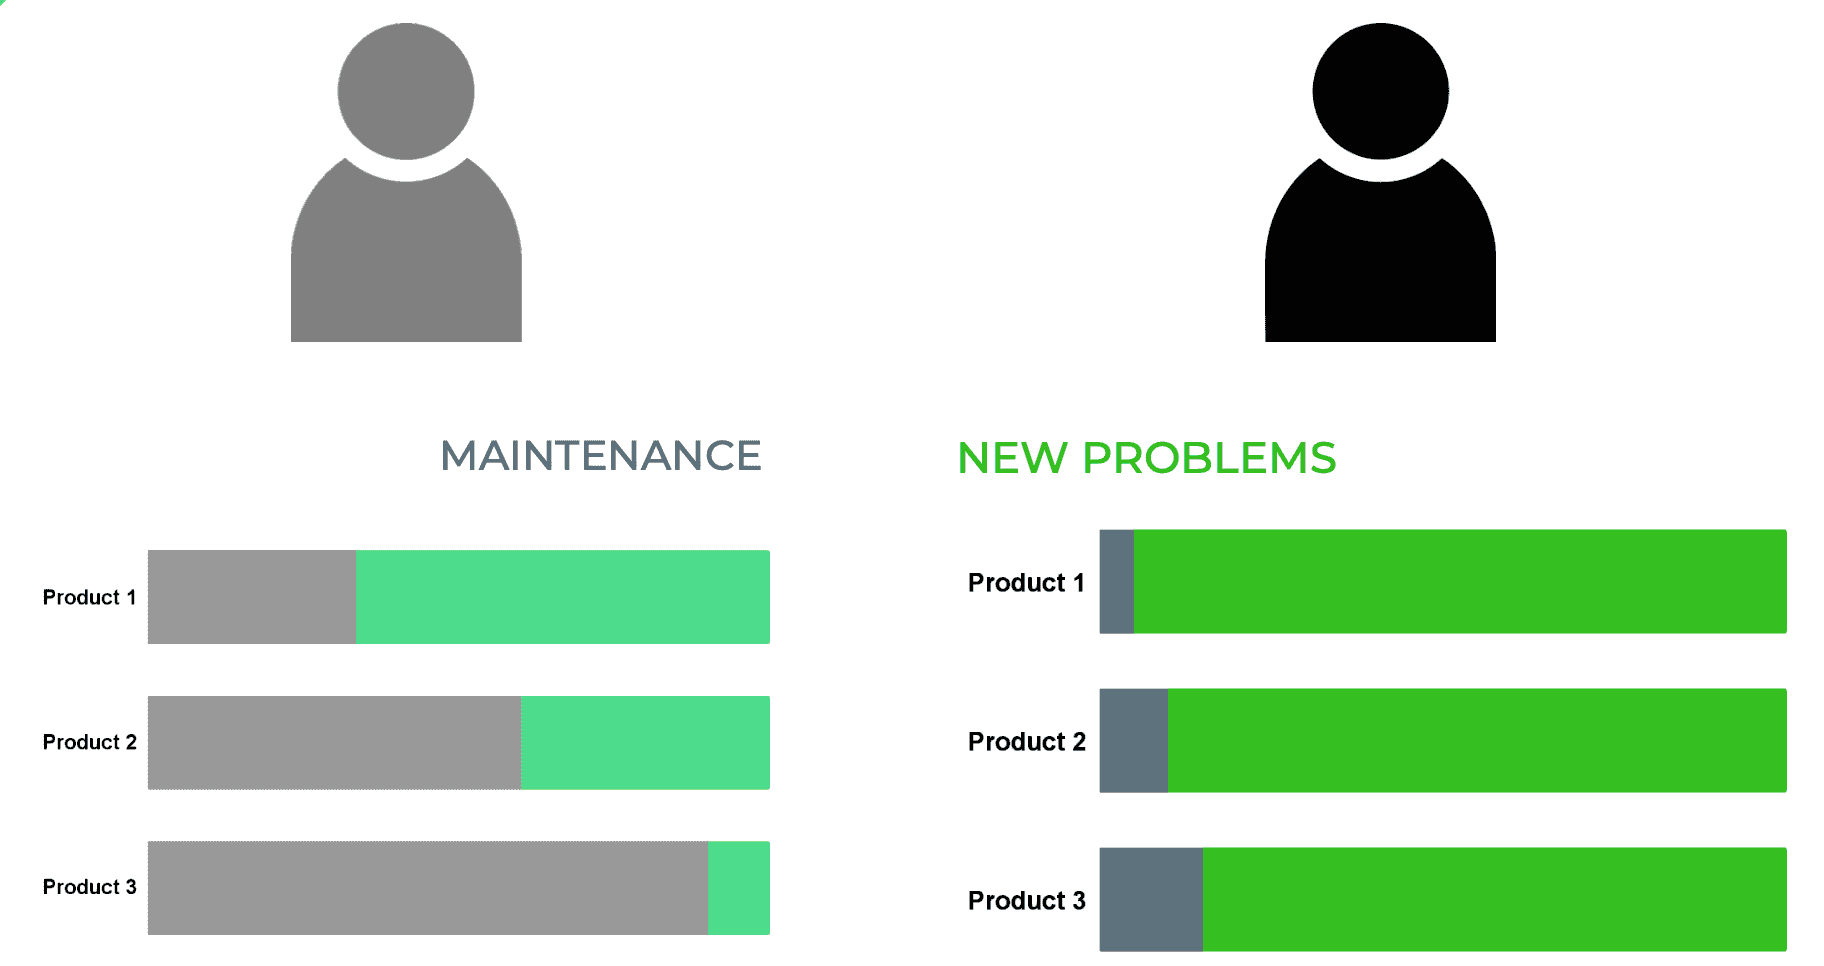
Example:
I started my career with the skillset of a Business Analyst. Inside my team we managed to create a spreadsheet report that became very popular inside our company. We were asked to refresh it once a week which took almost a full day of work for one person every week. After expanding my SQL and BI skills later on, I built many similarly complex reports with daily or even more frequent refresh schedules that required no maintenance at all for many weeks in a row.
Being aware that there are different types of people working with data should boost your confidence when planning your transition. You don’t have to know every possible technology from day one. There are many companies that will appreciate other skills as well. An approach that worked very well for me was leveraging my current skills to get as close as possible to my dream position. Initially it was pretty far away but from that point I was able to spend eight hours a day practicing and expanding my knowledge. Additionally, I was obviously being paid for it. There was no chance I could spend so much time learning after hours.
Example:
With a business background and no technical skills, the closest I could get to the field was becoming a Business Analyst. I was part of a finance team, mostly leveraging my domain knowledge and... spreadsheets obviously (finance people love spreadsheets) ;). In this role I was able to spend eight or more hours a day solving analytical problems within a finance domain. It was great for gathering experience and bought me plenty of time to catch up with my technical skills after hours. Slowly, over time I was able to shift towards a Data Analyst skill set.
If I were to give you some advice based on my experience, it would be something along these lines:
Think about your strengths. Try to find an activity that overlaps with what you can do and what you aim to do. Start building on that. Don’t rush things. Eventually you will get there.
We talk a lot about developing skills. But which skills are actually worth building? Here’s my subjective take on that. I’ve split the list into two groups: technical skills and business skills. I’ve marked some of them with cherries. These are the skills that are exceptionally well aligned with current trends. Adding them to your portfolio will help you to stand out from the crowd.
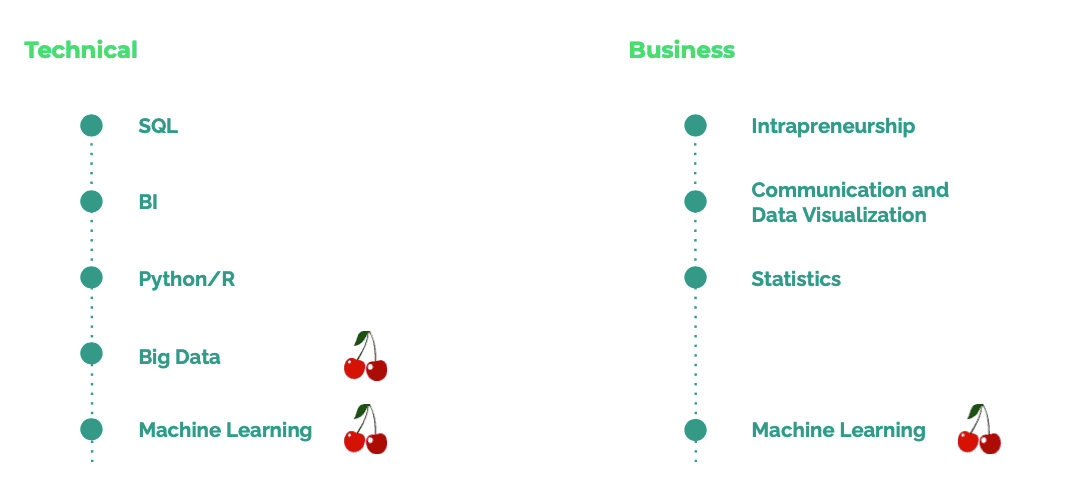

SQL is a relatively simple, yet powerful language that you can use to manipulate data in a database. It’s extremely popular. You will come across it in most companies and job offers. As a Data Analyst, you will spend lots of time processing data and SQL should become your best friend. It’s a declarative language which means that you use it to “describe” what you want to achieve. You don’t have to think about low level operations needed to get there. A database will figure it out for you. It’s also a great language if you have no prior coding experience. It’s very concise. With its simplicity, it’s a great test to check if you will enjoy writing code. It’s also a solid foundation for further development. If you don’t know how to start, I highly recommend “SQL Queries for Mere Mortals”, a book by John Viescas and Michael J. Hernandez.

BI tools allow you to make data available at the fingertips of business users. By providing interactivity, they dramatically improve the way people interact with data. The good news is that they are quite easy to start with. Mastery will take some time but fortunately you don’t need a black belt to complete many useful tasks. Some of the most popular tools on the market are PowerBI, Tableau and Data Studio. I’d recommend visiting their websites to see sample dashboards created using each of these tools. That will give you an idea of what they are capable of. Next, pick one tool that is most appealing to you (or your company), download a trial version and start playing around with it.

Learning a fully fledged scripting language will open completely new opportunities for you. You’ll be able to switch from basic statistics to more sophisticated data products and automate many, if not all parts of your workflow. Python is friendly for beginners and very powerful. It has many great libraries for working with data. It’s an excellent choice if you want to do things like data cleaning, analytics and visualization. A huge benefit is that it’s very universal. If you ever need a break from data, you’ll be able to build a website, application, web scraper or even a game. For data analytics, I’d recommend getting familiar with Pandas library and a visualization tool of your choice (like Plotly for example).
One of the most important features that I think distinguish great analysts from ones that are OK-ish is what I call “intrapreneurship”. For me it means thinking as if you were the owner of a company that you work for. But also having a huge dose of curiosity and courage to think independently. One thing that I’ve learned is that being driven by a problem to solve is much more effective than expecting other people to provide you with a detailed specification of what you should do. This skill is quite difficult to acquire other than in practice. You can try to get a sense of what it means by reading about the experiences of other people (for example here) and reading books from the cross section of business and analytics (for example “Naked Statistics” by Charles Wheelan, “Thinking Fast and Slow” by Daniel Kahneman or “Black Swann” by Nassim Taleb).
In data analytics it’s easy to focus on technical aspects and underestimate the importance of data visualization or communication in general. Your mind will shift immediately, if you realize that it doesn’t matter how much time you spend building your super fancy model if you fail to communicate the results. If people do not understand your analysis, it’s as if you never created it. It’s actually even worse because you have already spent a lot of your time on it. In the end, data problems are also business problems and they should generate business value. People who make decisions should understand this value, otherwise useful solutions may not get implemented. Two exceptional authors that can help improve your data communication skills are Edward Tufte and Stephen Few.
Why do I mention statistics so controversially late in the discussion? What I’ve noticed is that lots of companies don’t need very sophisticated models to start reaping the benefits of their data. What they need is a huge dose of data understanding and common sense. If you think about it, you probably want to collect low hanging fruits, before climbing to the very top of a tree. Don’t get me wrong. I highly encourage climbing that tree and developing your statistical skills over time. But if you are just getting started, it may be more useful for you to pick up the basics and start working with real problems. You’ll be able to first gain experience and then channel your further development towards the most urgent gaps in your knowledge.
I want to mention two more skills that are not needed to find your first job, but are very currently in demand. They also happen to be extremely interesting.
Big Data technologies allow you to process huge amounts of data to derive insights. Fortunately, current technologies make it quite painless for an analyst to start using them. Many solutions support SQL, which you can start using after understanding how to optimize your queries for Big Data. Cloud computing makes it even easier. You can set up your own Big Data database and experiment in practice.
Machine Learning is a rapidly growing field focused on using algorithms to “train” computers to do certain tasks, instead of writing explicit instructions. It proved to be especially successful in fields where the standard approach did not work very well, like image processing, speech recognition or autonomous driving. It can be also used to solve many other analytics problems, like time series forecasting, classification and regression. Currently, many companies see the potential in machine learning and want to start using it. That makes this skill even more valuable. If you want to join this train, Kaggle is a great place to start.
It may seem overwhelming at first, but it’s certainly doable. It’s definitely worth trying as Data Analytics can be a very exciting and rewarding career. I wish you good luck, and see you on the other side :)
Did you find careers as a Data Analyst attractive? Would you like to join a team of Big Data experts? Check our open job positions here.
Introduction As organizations increasingly adopt cloud-native technologies like Kubernetes, managing costs becomes a growing concern. With multiple…
Read moreNowadays digital marketing is a competitive business and it’s easy to tell that we are way past the point when a catchy slogan or shiny banner would…
Read moreIn today's data-driven world, maintaining the quality and integrity of your data is paramount. Ensuring that organizations' datasets are accurate…
Read more“How can I generate Kedro pipelines dynamically?” - is one of the most commonly asked questions on Kedro Slack. I’m a member of Kedro’s Technical…
Read moreIt’s been already more than a month after Big Data Tech Warsaw Summit 2019, but it’s spirit is still among us — that’s why we’ve decided to prolong it…
Read moreStreamlining ML Development: The Impact of Low-Code Platforms Time is often a critical factor that can make or break the success of any endeavor. In…
Read moreTogether, we will select the best Big Data solutions for your organization and build a project that will have a real impact on your organization.
What did you find most impressive about GetInData?