A Review of the Presentations at the Big Data Technology Warsaw Summit 2023
It has been almost a month since the 9th edition of the Big Data Technology Warsaw Summit. We were thrilled to have the opportunity to organize an…
Read moreA data-driven approach helps companies to make decisions based on facts rather than perceptions. One of the main elements that supports this approach is an accurate data model that represents the relationships between various information sources in a structured way. Reporting based on an accurate data model can bring insights about the current condition of a company, risks and potential benefits of both running and upcoming initiatives. Good data models should have clear structure, provide quality data and be documented as data definitions might not be unified across an organisation.
Looker is one of the business intelligence platforms that companies use to explore and visualize their data. It has a user-friendly interface, allowing users to create custom reports and dashboards. This business intelligence platform allows the unification of analytics across multiple data sources and helps companies become more data-driven organizations.
Would you like to see Looker in action and compare its abilities with tools such as PowerBI, Tableau and Looker Studio? If so, join our upcoming webinar: BI Toolbox Talks: Which Analytics Tool Should You Use or Not Use in 2024? where we will be discussing the criteria for choosing the right tool, show you the process of selecting the tool and drive a live demo with all of them.
One of the key features of Looker is an SQL-based modelling language called LookML. It allows you to transform data, define relationships between entities and add descriptions for a common dictionary. It also allows adding tests to validate the accuracy of results. Looker enables the storage of the outcomes of a SQL query in a database table in a warehouse, this feature is called persistent derived table (PDT). This type of derived table can be used to improve the performance of reporting as the results of the query that is creating PDT is stored in your database. The table is rebuilt only when needed, for instance, when new records are created in the source table.
Next to the PDT, there is another tool for modelling data that can align with Looker- dbt. This framework allows you to create transformations in SQL language, add tests and have very user-friendly documentation. It is not meant to replace LookML but it can be incorporated into Looker in some scenarios. Similar to Looker’s PDT, you can save transformed tables in your database and define under what conditions the results should be updated.
It doesn’t matter if we use dbt or PDT for any modelling approach. Looker requires the data warehouse as a storage for data. In this article we used Google BigQuery. It supports both PDTs and can be easily integrated with dbt. The warehouse supports the dialect of SQL. It allows the user to create and test transformation queries before they are added into a PDT or dbt model. It also gives a quick insight into query performance, and number of generated rows, and once the transformed table is saved in the database, it allows you to check the history of usage.
Which tool is better and when? Let’s compare these two tools in real examples to help you understand which approach might be better for specific scenarios.
In this demonstration, we will present how to model your organisation data for future analysis in Looker. We will create a report that will look the same from a UI perspective, but on the backend, we will show you two different approaches for data modelling - by using PDT and dbt. We will also add a quality test and show the possibilities of documentation. We hope to answer the question as to which approach might be better for specific scenarios.
For both cases, the data source is a public dataset called `theLook eCommerce` available on Google Marketplace. Our business goal is to have easy access to the company's monthly revenue in 2023.
Firstly, we would like to present the data flow. The dataset is stored in BigQuery. To calculate the revenue, we need 3 raw tables: `orders`, `order_item`s and `users`. The tables will be transformed in Looker using the PDT feature and the result of that will be stored in BigQuery as a table.
The data flow looks like this:
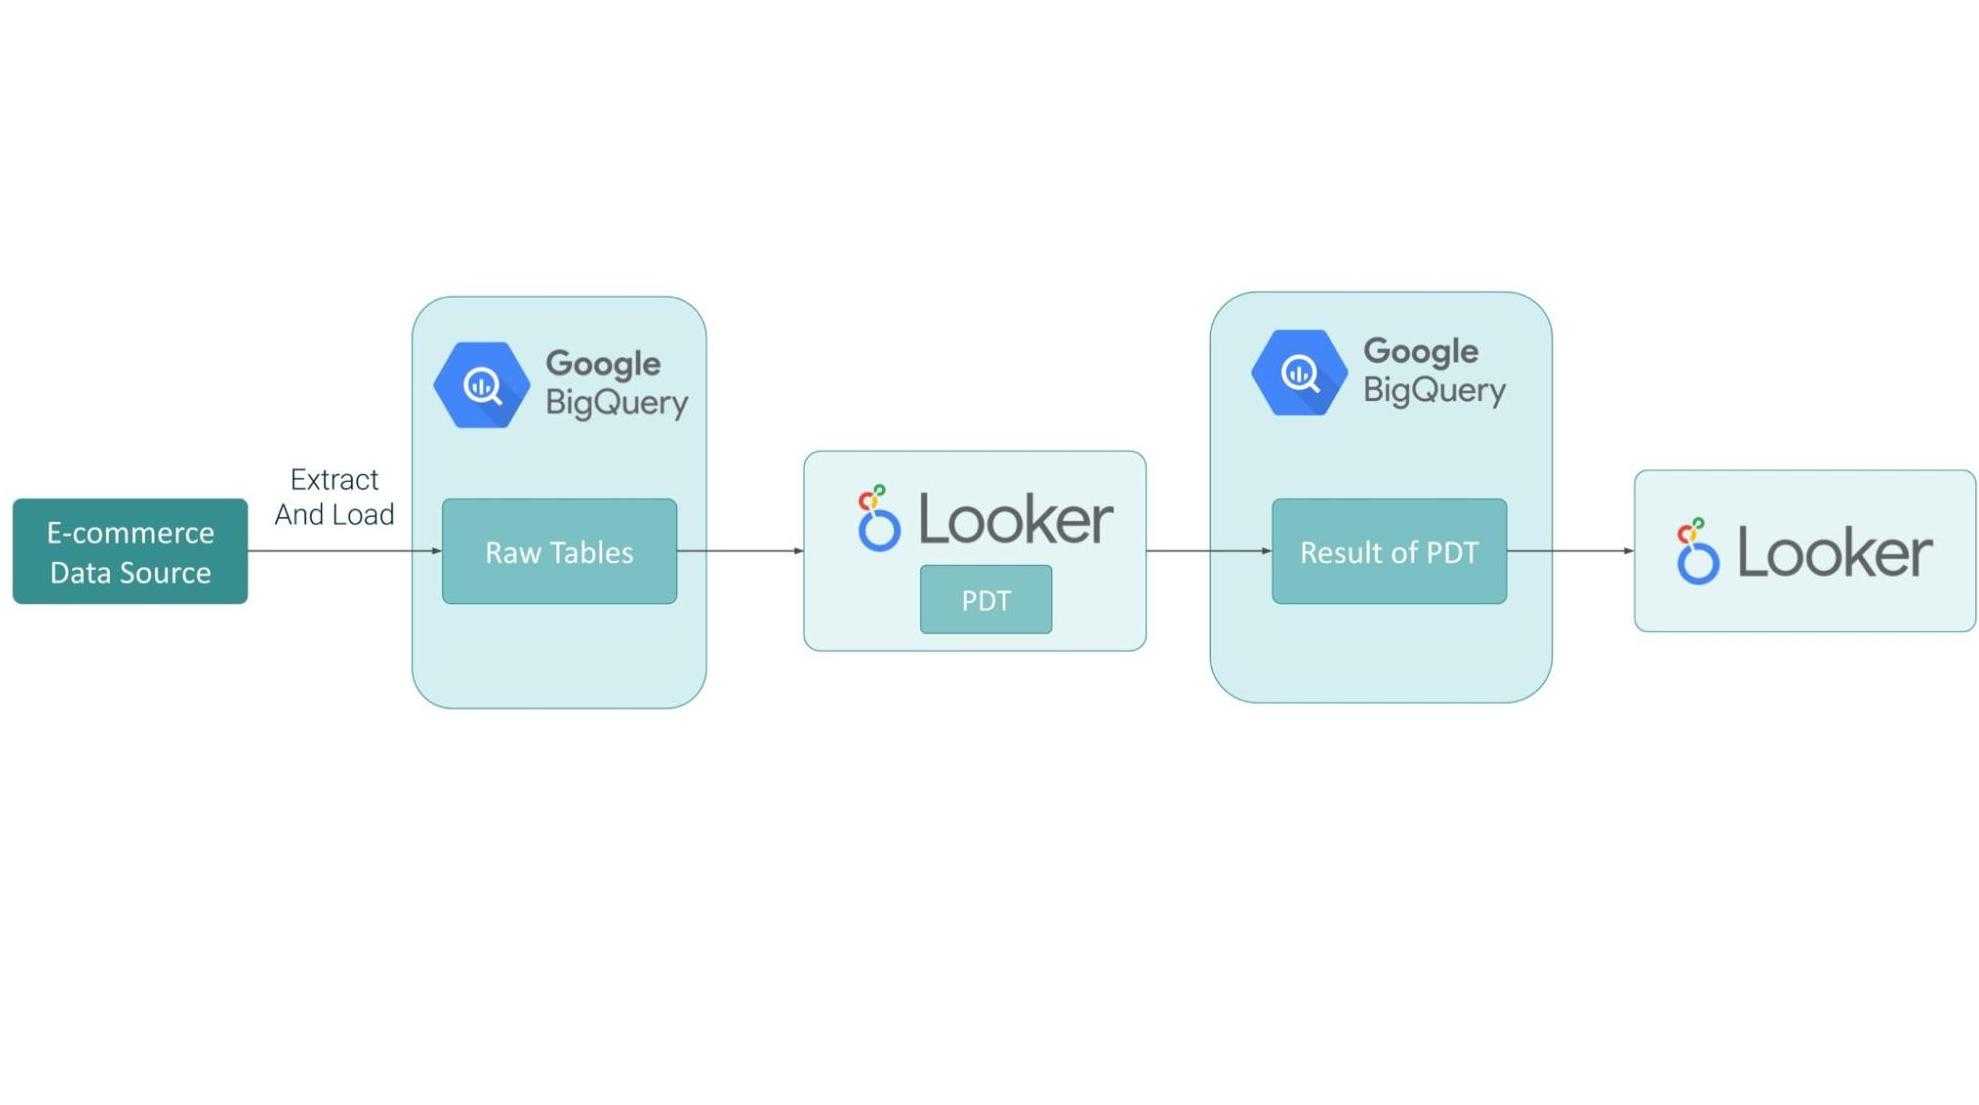
All transformations, filters and relationships will be defined in Looker code. We aim to create one PDT, and below we present a snippet of code:
 view: fact_revenue_pdt {
  derived_table: {
    sql: WITH
        fact_revenue AS (
        SELECT
          o.created_at AS order_date,
          u.ID AS customer_id,
          SUM(oi.sale_price*o.num_of_item) AS revenue
        FROM
          `dbt-models.e_commerce.order_items` AS oi
        LEFT JOIN
          `dbt-models.e_commerce.orders` AS o
        ON
          oi.order_id = o.order_id
        LEFT JOIN
          `dbt-models.e_commerce.users` AS u
        ON
          oi.user_id = u.id
        WHERE
          EXTRACT(YEAR
          FROM
            o.created_at) >= 2023
          AND oi.status NOT IN ('Cancelled',
            'Returned')
        GROUP BY
          1,
          2 )
      SELECT
        GENERATE_UUID() AS primary_key,
        order_date,
        customer_id,
        SUM(revenue) AS revenue
      FROM
        fact_revenue
      GROUP BY
        1,
        2,
        3 ;;
    sql_trigger_value: SELECT MAX(created_at) FROM `dbt-models.e_commerce.order_items`;;


  }


  dimension: primary_key {
    description: "The primary key for this table"
    hidden: yes
    type: string
    sql: ${TABLE}.primary_key ;;
  }


  dimension_group: order {
    type: time
    timeframes: [date, month, year]
    sql: ${TABLE}.order_date ;;
  }


  dimension: customer_id {
    value_format_name: id
    type: number
    sql: ${TABLE}.customer_id ;;
  }


  dimension: revenue {
    hidden: yes
    type: number
    sql: ${TABLE}.revenue ;;
  }


  measure: total_revenue {
    description: "Revenue in USD"
    type: sum
    value_format: "$0.00"
    sql: ${revenue} ;;
 }


  measure: count_customer_id {
    description: "Field added for testing purpose"
    hidden: yes
    type: count_distinct
    sql: ${TABLE}.customer_id ;;
    }
}
In code, we refer to the original names of the dataset, tables and columns. We clean and aggregate the data, and the result of this query rebuild is stored in the BigQuery warehouse. Each time (except PDT rebuild), when someone runs a report that uses explore based on this PDT query, it will run against the derived table results, not raw tables.
In the Looker model, it is exposed as a standalone explore. For this particular case, there is no need to expose raw tables as views separately; all transformations were done in one PDT view file. Below you can find a code snippet of a model object.
connection: "dbt_annaw"


include: "/views/raw_sources/fact_revenue_pdt.view.lkml"
include: "/views/raw_sources/tests.lkml"


datagroup: ecommerce_etl {
  sql_trigger: SELECT max(created_at) FROM `dbt-models.e_commerce.order_items`;;
  max_cache_age: "24 hours"
}


explore: fact_revenue_pdt {
  label: "Fact Revenue"
}
One important note about adding primary keys in views: it is crucial in Looker to calculate the symmetric aggregations properly. For our case, we do not have a native primary key so it is good practice to create one by generating a UUID in a derived table, or concating multiple columns from tables. Looker allows us to add a test for column uniqueness, and in our case, a snippet of code for the customer table looks like this:
test: customer_id_is_unique {
  explore_source: fact_revenue_pdt {
    column: customer_id {}
    column: count_customer_id {}
    sorts: [count: desc]
    limit: 1
  }
  assert: customer_id_is_unique {
    expression: ${fact_revenue_pdt.count_customer_id} = 1 ;;
  }
}
As you see, writing tests in Looker look a bit complex for simple checks. Here, we also test our data in the BI tool, and we believe it is better to do so the step before.
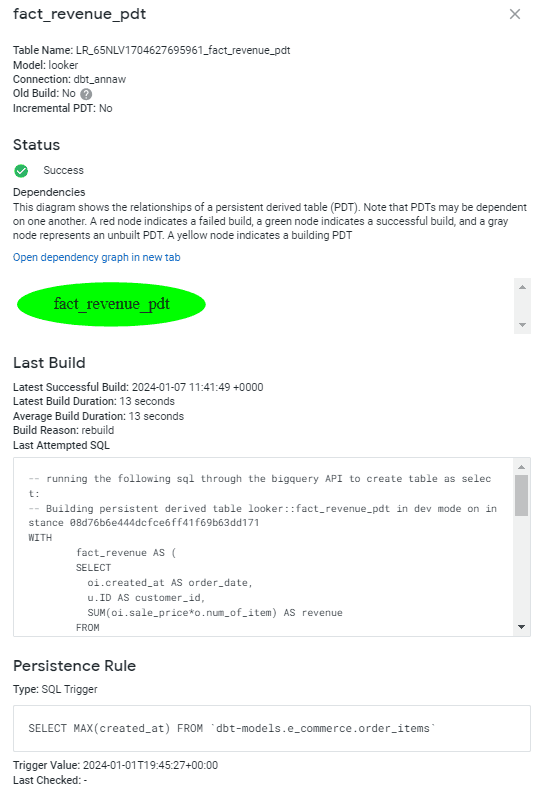
An additional aspect of creating a good model is documentation. LookML allows users to add descriptions that will be visible for business users and comments in code for developers. However, to have a full outlook over your PDT details, the user needs to have admin rights to see it. The sample for our case looks like this:
For the approach where dbt is used, the dataset is stored in BigQuery. We will use the exact same tables to perform transformations in the dbt model file.
The data flow for this scenario looks like this:
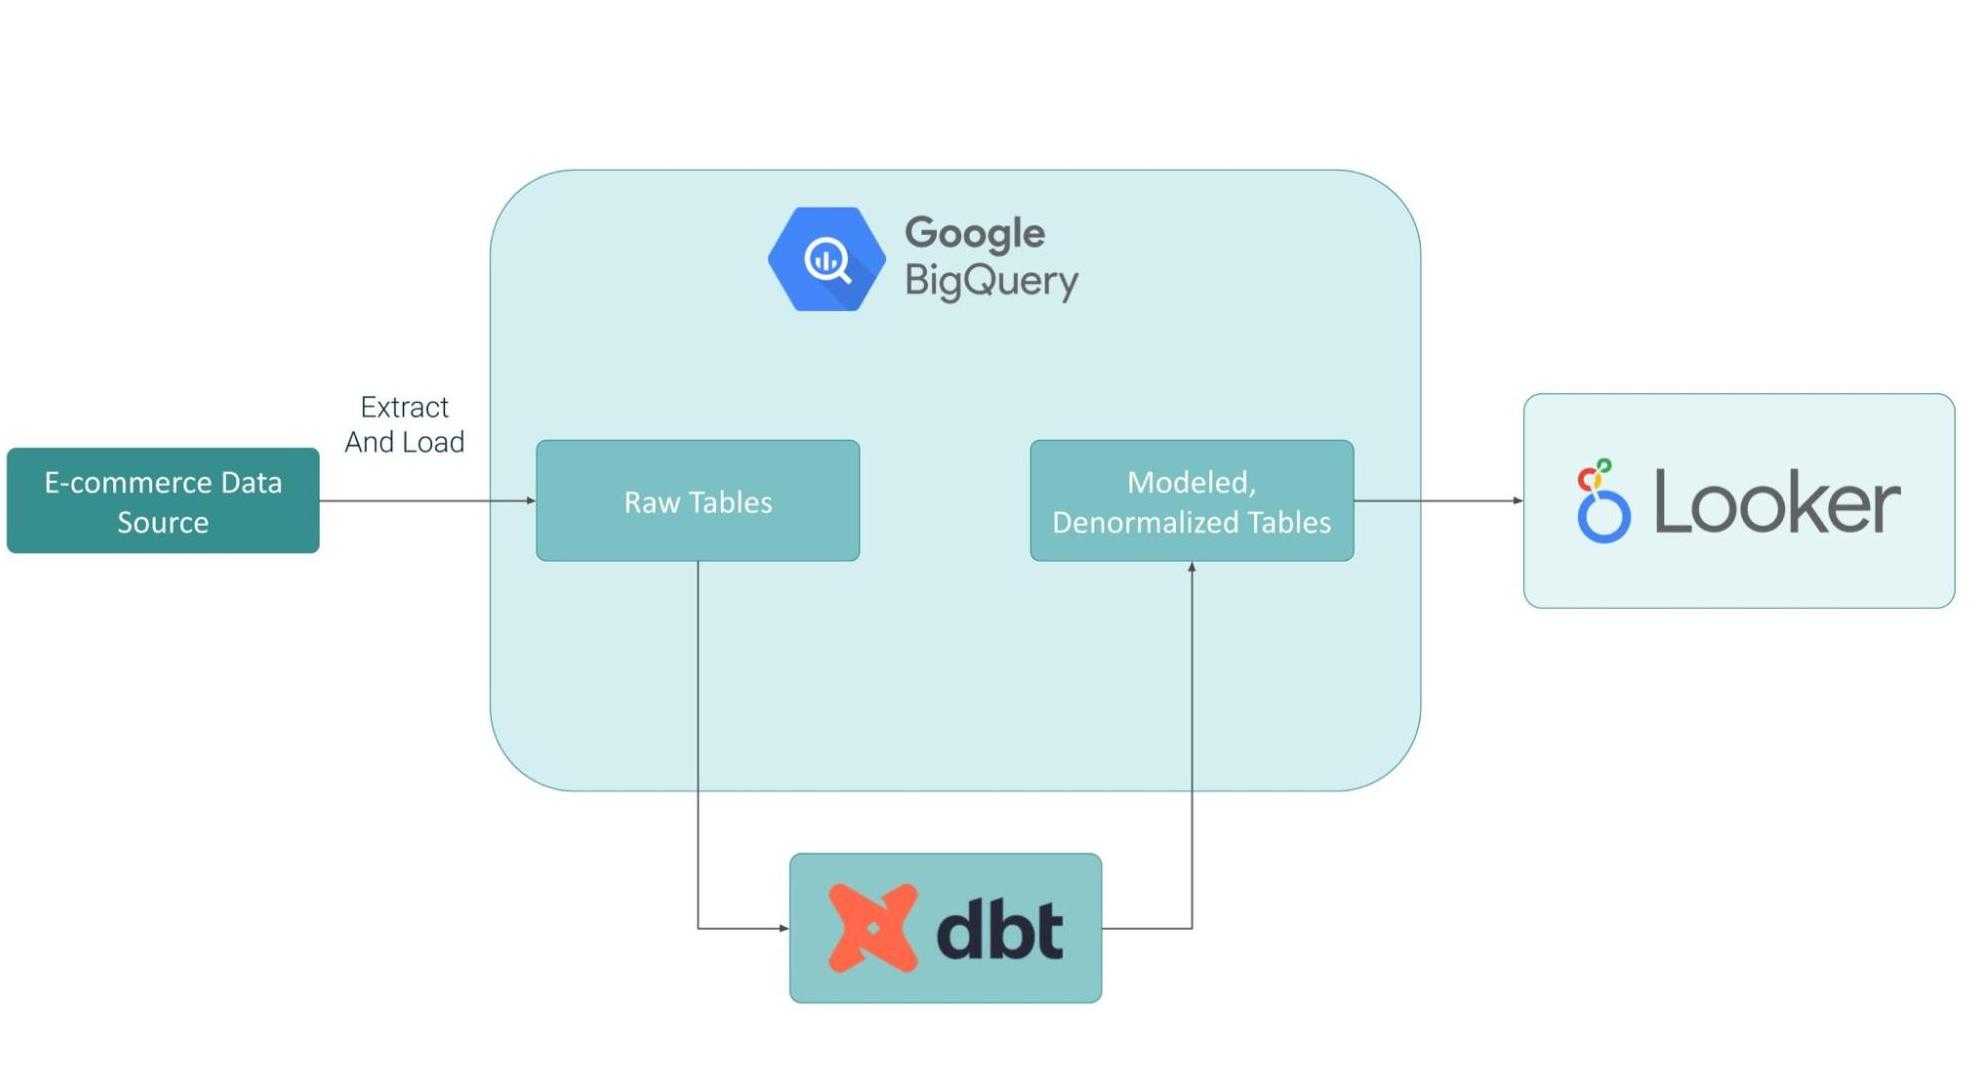
To run the dbt model, first we need to do the configuration. You can find the whole path step by step with commands in this article: Up & Running: data pipeline with BigQuery and dbt.
All transformations, filters and relationships will be defined in the dbt model code file called `fact_revenue.sql`. The query looks almost the same as for the transformation created earlier in PDT
config {
  materialized: 'table',
  strategy: 'timestamp',
  updated_at: 'created_at'
}


WITH
  fact_revenue AS (
  SELECT
    o.created_at AS order_date,
    u.ID AS customer_id,
    SUM(oi.sale_price*o.num_of_item) AS revenue
  FROM
    `bigquery-public-data.thelook_ecommerce.order_items` AS oi
  LEFT JOIN
    `bigquery-public-data.thelook_ecommerce.orders` AS o
  ON
    oi.order_id = o.order_id
  LEFT JOIN
    `bigquery-public-data.thelook_ecommerce.users` AS u
  ON
    oi.user_id = u.id
  WHERE
oi.status NOT IN ('Cancelled',
      'Returned')
  GROUP BY
    1,
    2 )
SELECT
  GENERATE_UUID() AS primary_key,
  order_date,
  customer_id,
  SUM(revenue) AS revenue
FROM
  fact_revenue
GROUP BY
  1,
  2,
  3
Additionally in dbt we added field descriptions and tests for uniqueness of the primary key in the shema.yml file.The whole code looks like this:
version: 2


models:


  - name: fact_revenue
    description: "Table contains revenue data"
    columns:
      - name: primary_key
        description: "The primary key for this table"
        tests:
          - unique
      - name: revenue
        description: "Revenue in USD"
Adding tests in dbt is very easy. Besides simple tests, you can expand the possibilities of the package `dbt-expectations`. An additional perk of using dbt and describing columns is that you can generate eye - friendly documentation with relationship graphs, performed tests, compiled code and much more.
Sample documentation for fact_revenue table looks like this and is also available for users with roles other than a developer.
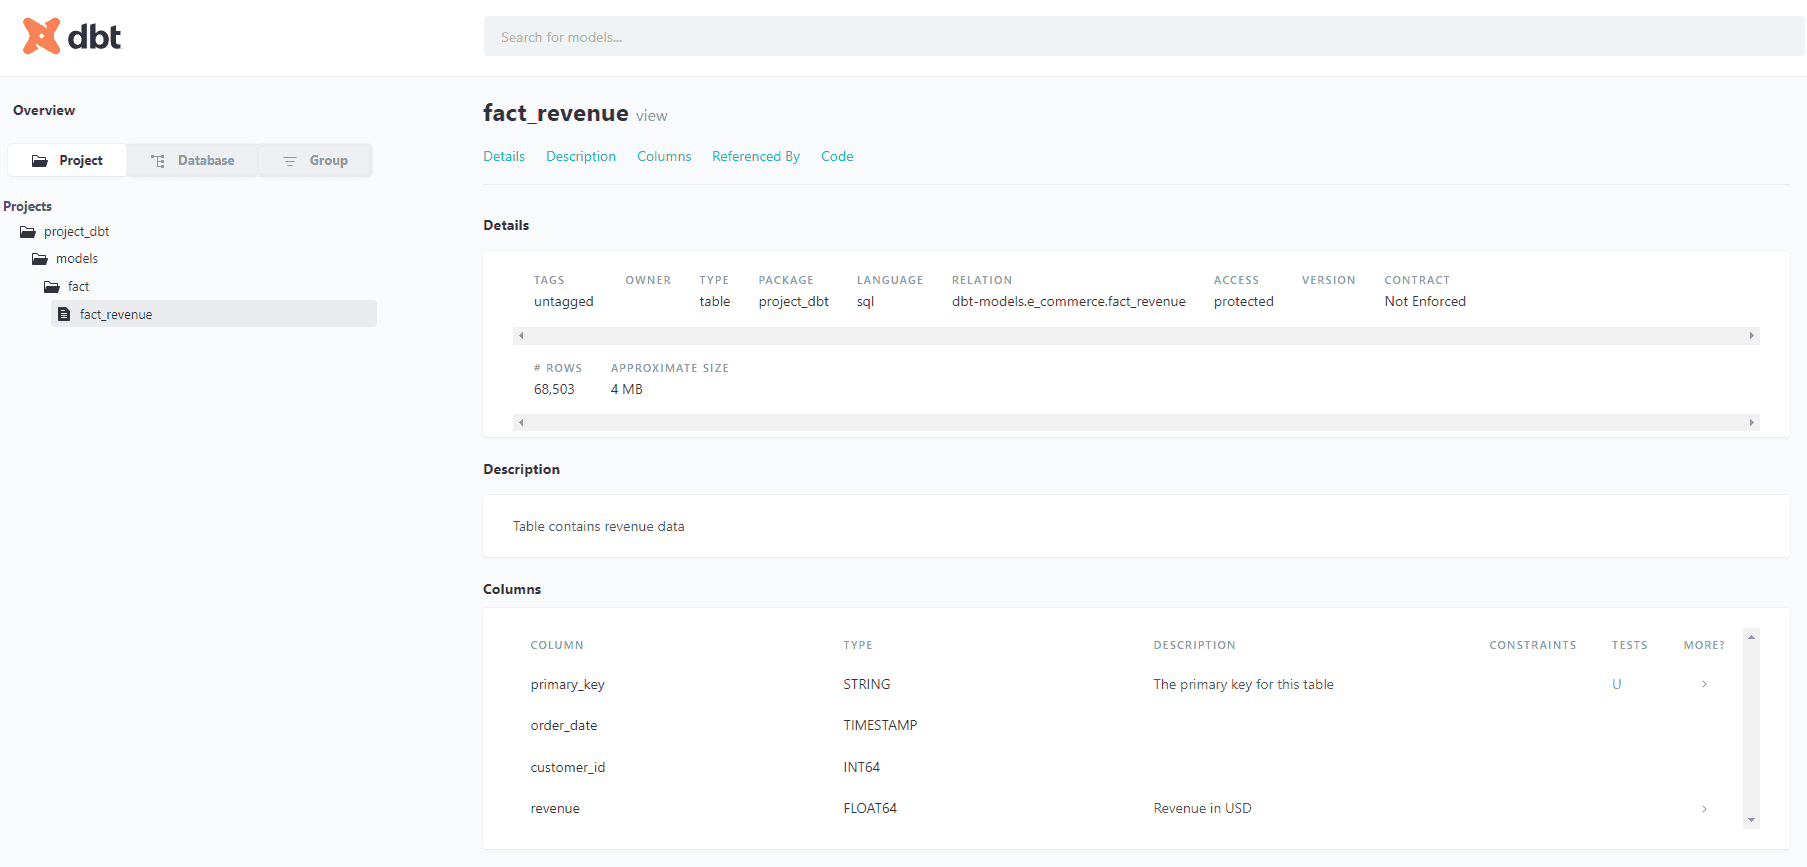
You can quickly review newly created objects and check code that creates transformations and applied tests.
An exposed dbt table as a view in Looker will look different than PDT. The transformation query is not visible as it is defined in the dbt query. We just point at newly created `fact_revenue` table. What source tables, which filters were applied and how revenue was calculated are not visible. That might extend the process of debugging the Looker report errors as code as developers will need to check code from a separate tool. Below you can find the whole view object:
view: fact_revenue {


  sql_table_name: `dbt-models.e_commerce.fact_revenue` ;;


  dimension: primary_key {
    primary_key: yes
    hidden: yes
    description: "The primary key for this table"
    type: string
    sql: ${TABLE}.primary_key ;;
  }


  dimension_group: order {
    type: time
    timeframes: [date, month, year]
    sql: ${TABLE}.order_date ;;
  }


  dimension: customer_id {
    value_format_name: id
    type: number
    sql: ${TABLE}.customer_id ;;
  }


  dimension: revenue {
    hidden: yes
    type: number
    sql: ${TABLE}.revenue ;;
  }


  measure: total_revenue {
    description: "Revenue in USD"
    type: sum
    value_format: "$0.00"
    sql: ${revenue} ;;
  }


}
This table exposed as a view is also exposed as a standalone explore in Looker. The end user won't notice any difference in UI between explore based on PDT and a dbt table, so which approach is better?
As mentioned before - the end user won't spot any differences in the generated report, even if we used 2 different modelling approaches. Below you can see a generated report.
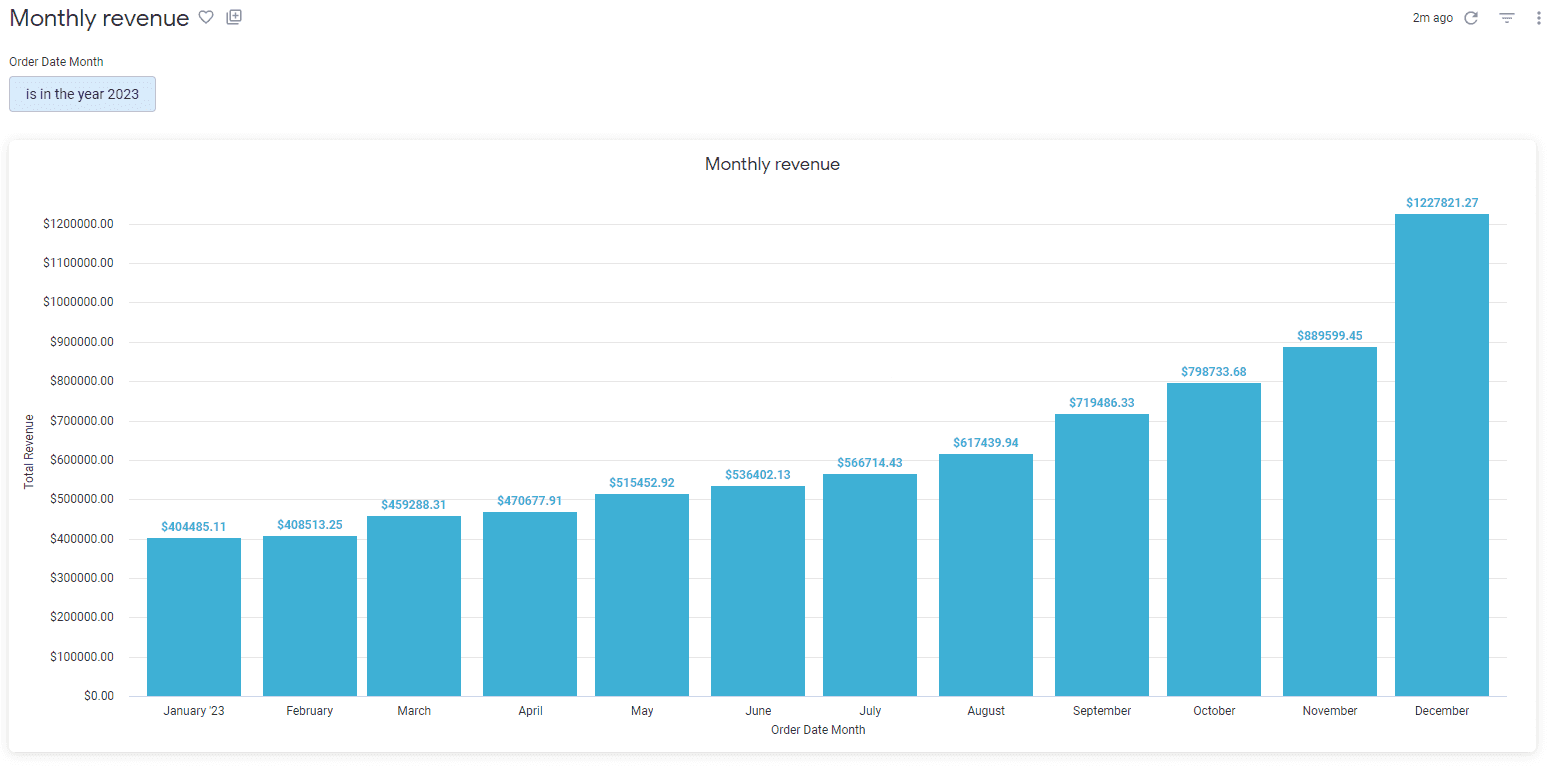
Code snippets that have been generated in the above graph also look very similar - there is a difference in name of source.
SELECT
    (FORMAT_TIMESTAMP('%Y-%m', fact_revenue_pdt.order_date )) AS fact_revenue_pdt_order_month,
    COALESCE(SUM(fact_revenue_pdt.revenue ), 0) AS fact_revenue_pdt_total_revenue
FROM `dbt-models.looker_scratch.LR_65NLV1704627695961_fact_revenue_pdt` AS fact_revenue_pdt
WHERE ((( fact_revenue_pdt.order_date  ) >= ((TIMESTAMP('2023-01-01 00:00:00'))) AND ( fact_revenue_pdt.order_date  ) < ((TIMESTAMP(DATETIME_ADD(DATETIME(TIMESTAMP('2023-01-01 00:00:00')), INTERVAL 1 YEAR))))))
GROUP BY
    1
ORDER BY
1 DESCSELECT
(FORMAT_TIMESTAMP('%Y-%m', fact_revenue.order_date )) AS fact_revenue_order_month,
COALESCE(SUM(fact_revenue.revenue ), 0) AS fact_revenue_total_revenue
FROM `dbt-models.e_commerce.fact_revenue` AS fact_revenue
WHERE ((( fact_revenue.order_date ) >= ((TIMESTAMP('2023-01-01 00:00:00'))) AND ( fact_revenue.order_date ) < ((TIMESTAMP(DATETIME_ADD(DATETIME(TIMESTAMP('2023-01-01 00:00:00')), INTERVAL 1 YEAR))))))
GROUP BY
1
ORDER BY
1 DESCTaking into account the differences presented above, let’s focus on some aspects to compare both methods.
How clear is the model code structure?
As displayed in both cases above, we used the same logic and SQL query to create a fact table. However, for PDT, the whole code with conditions is in one place in Looker repository, where for the dbt table the developer would have to use both sources for debugging or refactoring. As PDT is a native feature, it might be more handy to check the sources of data.
Cost of additional tool
There might be a scenario where a company is also using other analytics tools. In this case, dbt allows the user to build models that can be reasusable as sources of data. For our demo we created a revenue fact table that could be used as a KPI by multiple teams across an organization, therefore doing transformations in dbt will be more convenient.
Move to another BI platform
It's also possible that one day a company will decide to change a BI tool and rewrite the code for the model. It will be more handy to reuse the code from dbt than Looker and its syntax. Additionally, we believe that dbt is easy to learn and implement in production. It's it's also easy to train the analysts that maintain dbt models, meaning that it could be a good investment.
Accuracy of data model
For both approaches we can implement tests to validate the results. However, adding tests in dbt is way easier in development. For most common cases we can define it in configuration with 2 lines of reusable code. It is also important to spot bugs as early as possible. Flow with using dbt allows the user to do it before the data lands in Looker.
Model documentation
Both methods allow the adding of comments about exposed metrics. However we believe that dbt delivered more user-friendly documentation about transformed tables. It is also visible at first glance what tests were implemented and what are the definitions of columns. dbt is also an open framework and there is less risk that the organisation will lose access to documentation of the model when Looker is replaced by another platform.
Taking that into consideration, we can also see that switching between 2 sources of documentation might not be very handy and well decrypted. Looker fields might be enough for most cases.
The flexibility of generating aggregates
All aggregates must be defined in Looker. We can not move this to DBT as all pre-aggregated data becomes dimensions with this approach.
For the simple case that we presented in this article, we lean towards a combination of dbt and Looker because of more options to validate and document data during development. It's also a safe option to have reusable code in case of the need to switch to another reporting system other than Looker.
To sum up, we recommend using both. If something can be modelled in DBT, it’s beneficial to use such tables outside of Looker. However, there are some use cases, such as parametrised and liquid queries, which have to be modelled in LookML.
Do you have any questions? Feel free to sign up for a free consultation with our experts, and don’t forget to watch the webinar on-demand.

It has been almost a month since the 9th edition of the Big Data Technology Warsaw Summit. We were thrilled to have the opportunity to organize an…
Read moreLet’s take a moment to look back at 2024 and celebrate everything we’ve achieved. This year has been all about sharing knowledge, creating impactful…
Read morenote: Read the second part of this post here. Introduction Many companies nowadays are facing the question, “How can I get value from my data easier…
Read moreWe would like to announce the dbt-flink-adapter, that allows running pipelines defined in SQL in a dbt project on Apache Flink. Find out what the…
Read moreToday's fast-paced business environment requires companies to migrate their data infrastructure from on-premises centers to the cloud for better…
Read moreThe 8th edition of the Big Data Tech Summit is already over, and we would like to thank all of the attendees for joining us this year. It was a real…
Read moreTogether, we will select the best Big Data solutions for your organization and build a project that will have a real impact on your organization.
What did you find most impressive about GetInData?