ETL 2.0 Why you should switch into stream processing
If you are looking at Nifi to help you in your data ingestions pipeline, there might be an interesting alternative. Let’s assume we want to simply…
Read moreIn Developer life there is a moment when the application that we create does not work as efficiently as we would expect. In cases such as these, we reach out to tools that allow us to profile our application in order to verify memory and CPU consumption. These tools are mainly memory and CPU profilers like JVisualVM, Java Mission Control and yourKit to name a few. One great addition to those are Flame Graphs. To quote the official Flame Graph doc: Flame graphs are a visualization of hierarchical data, created to visualize stack traces of profiled software so that the most frequent code-paths can be identified quickly and accurately.
A Flame Graph won't show you how much time you spend on executing the method, but instead will show you what percentage of total execution time was spent on this particular method. Equipped with this information, you can easily identify bottlenecks in your application.
It so happens that as of Flink 1.13, Flame Graphs are natively supported in Flink. However, the small problem with Flame Graphs produced by Flink is that you can't take a snapshot of Flame Graph data and analyze it later or offline in detail. This is because a Flame Graph is periodically refreshed during job execution and is no longer available after a job has finished, which creates a problem for batch jobs. In this article I will show how you can extract Flame Graph data for offline analysis from the Flink UI.
To enable Flame Graphs, the rest.flamegraph.enabled option in conf/flink-conf.yaml on the Job Manager node has to be set to true. After enabling this option, a new tab titled “FlameGraph” will be available on the Flink UI. In order to produce a Flame Graph, you have to navigate to the job graph of a running job, select an operator of interest and in the menu to the right, click on the Flame Graph tab. For our example, we will be looking at On-CPU mode only.
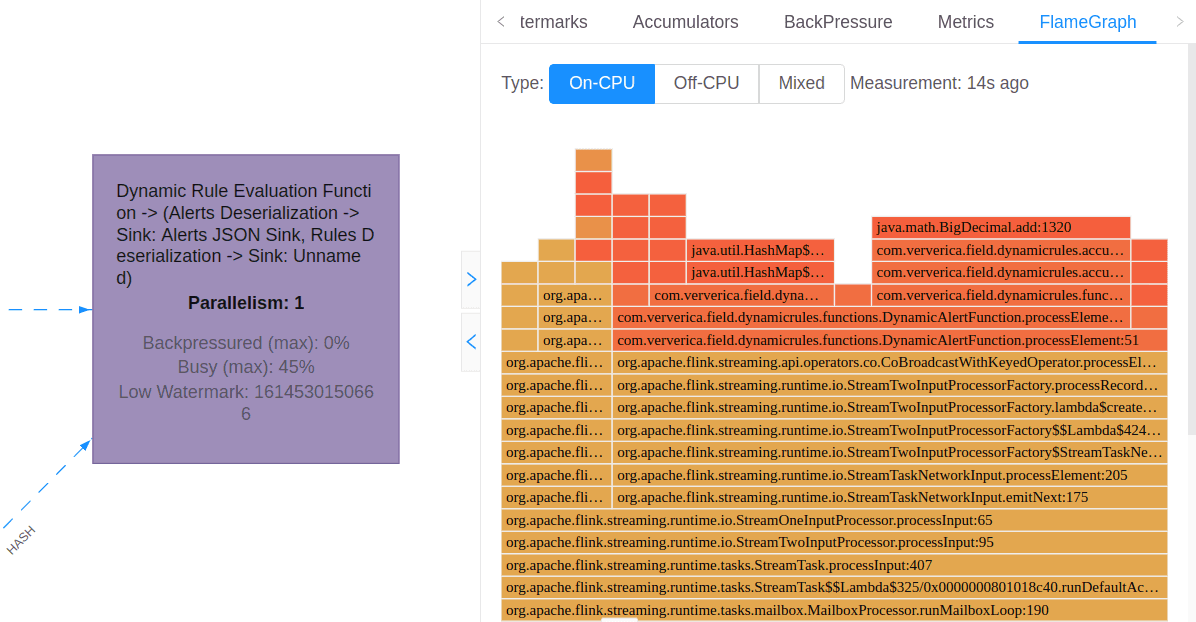
After clicking the “FlameGraph” tab, the system will start to collect stack samples. After some time, the Flame Graph image will appear on the screen.
As a test job, we will use a simple Flink streaming Job that processes a stream of events expressed as an “Order” entity. Apply anonymization on party information, then create or assign the already created session ID. Later, orders are printed in cluster logs. The source code of this job can be found here.
This is the same project that we used in our previous tech blog titled Writing Flink jobs using Spring dependency injection framework. If you haven't read that one, make sure you do. It demonstrates how the Spring framework can be used for building your Flink Jobs.
Now, let's get back to Flink Flame Graphs.After the Flink job is submitted to the Flink cluster and successfully initialized, navigate to the job graph and select the “Process → Sink” box, then select the “FlameGraph” tab.
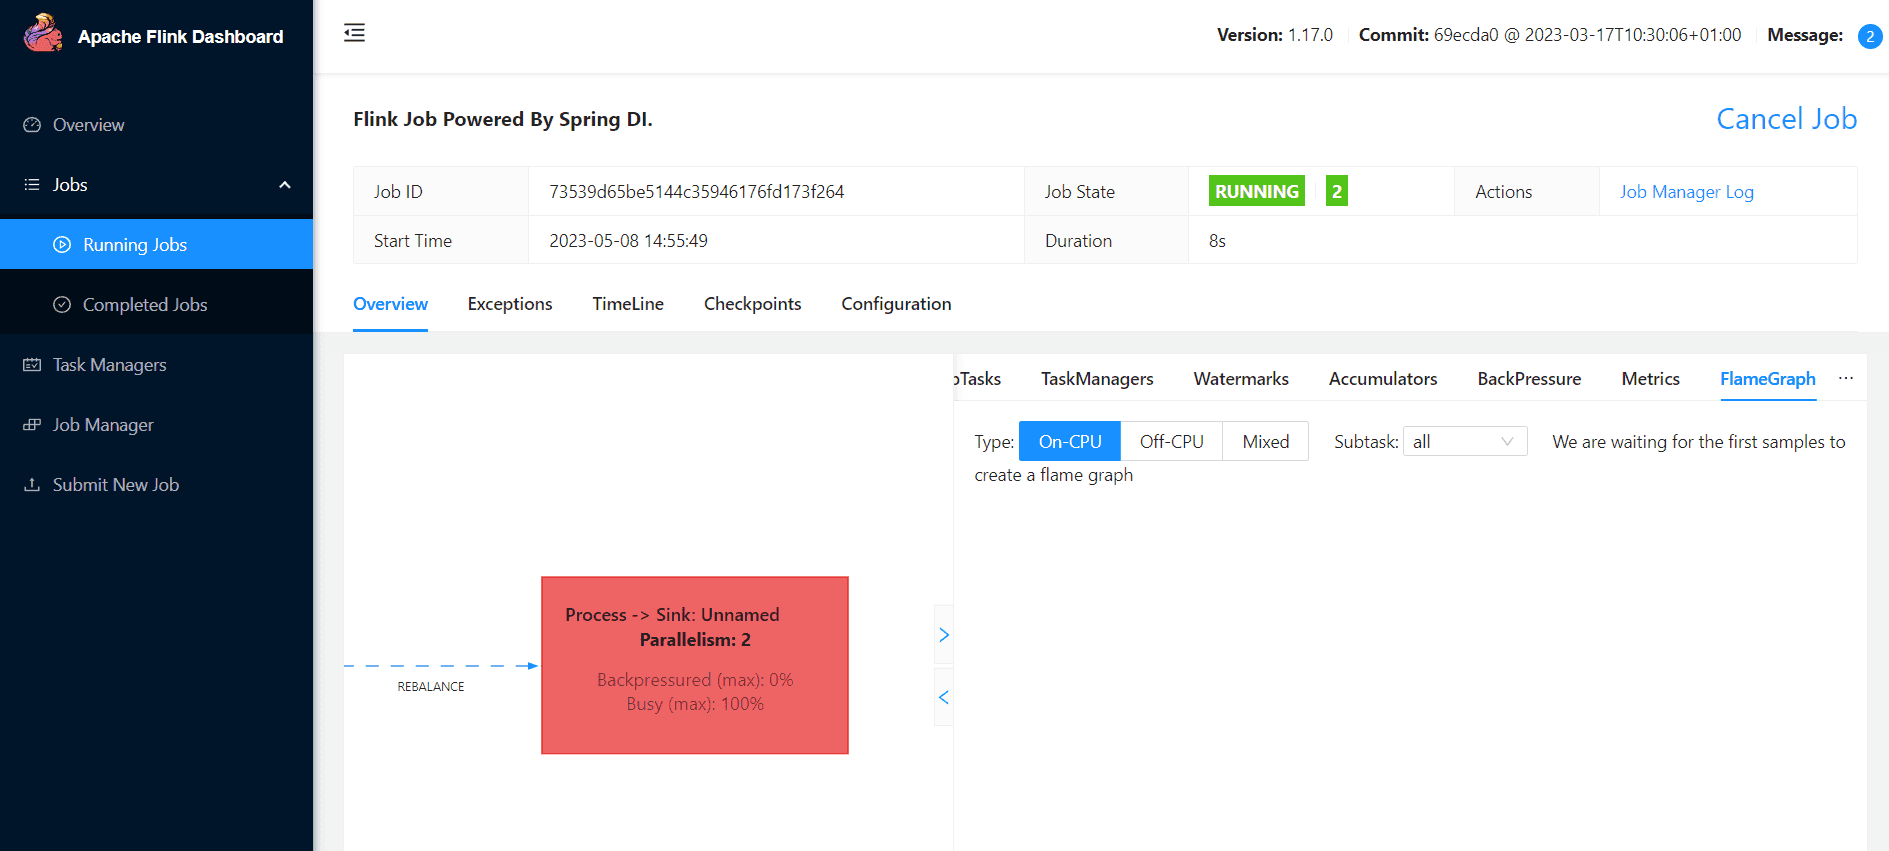
After some time, measurement results should appear on the screen.
Now the hacky part. When you manage to capture the checkpoint data, make sure that you see the full flame graph data –> root bar on the bottom.
Then:
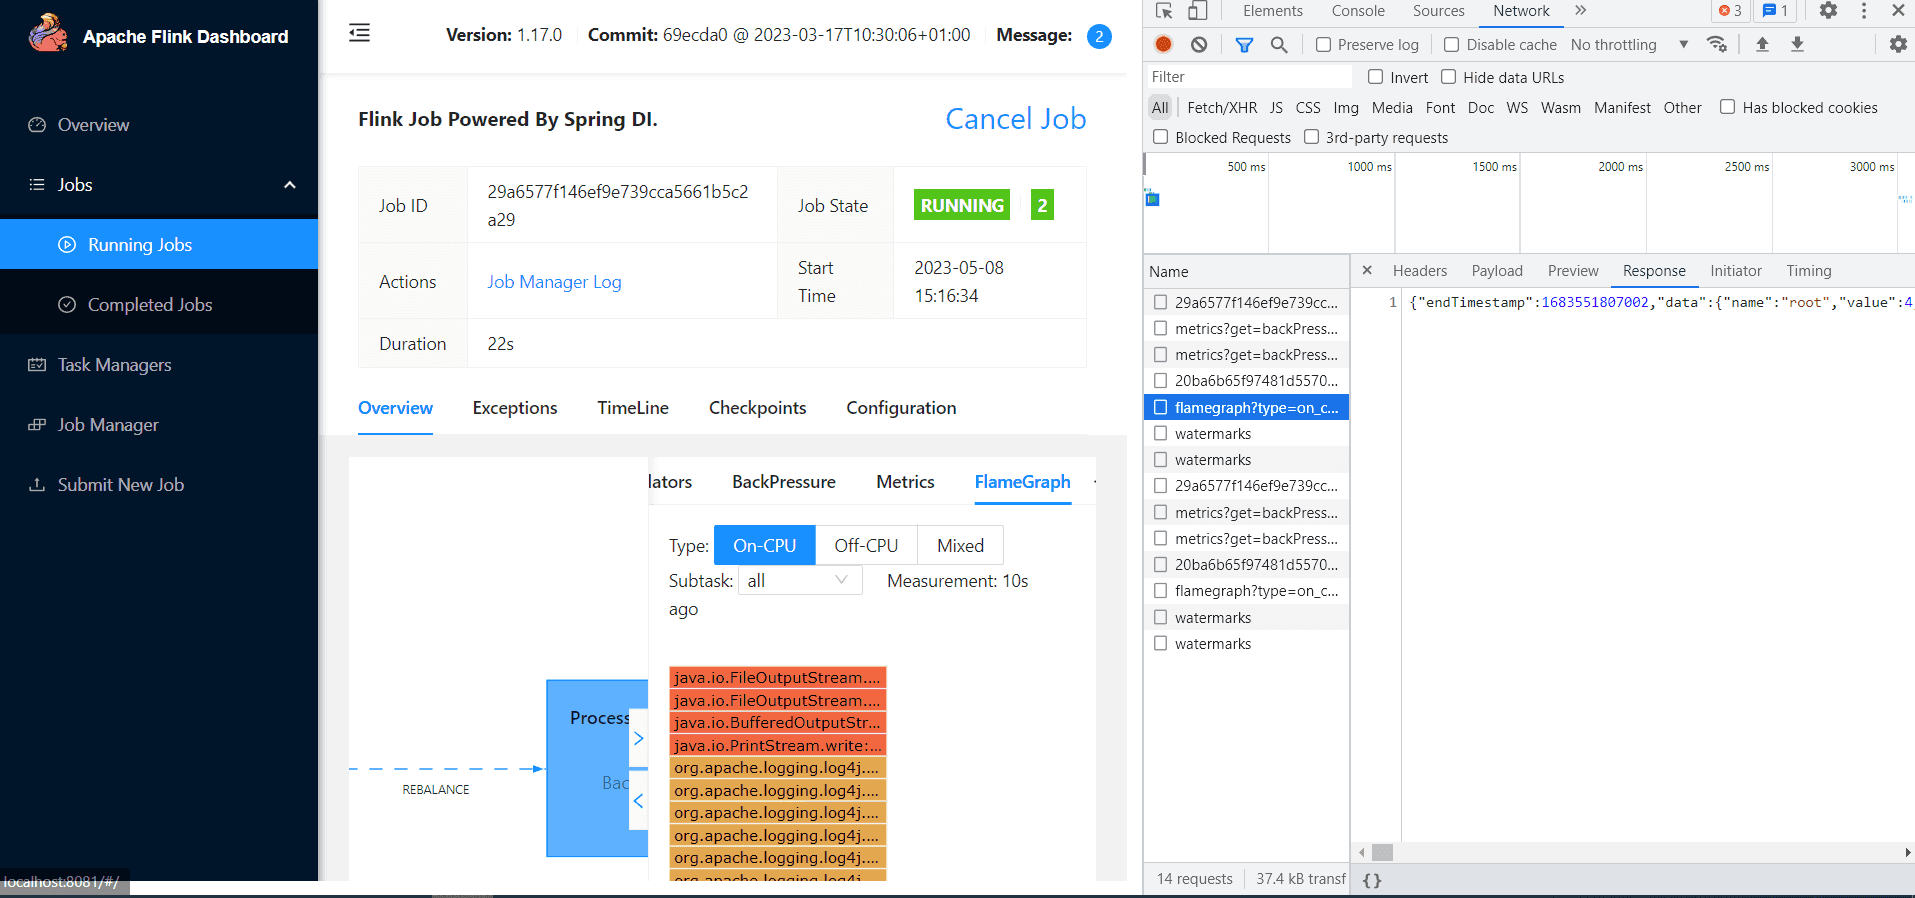
After finding the request, double click on it. The request response should be presented in the browser.
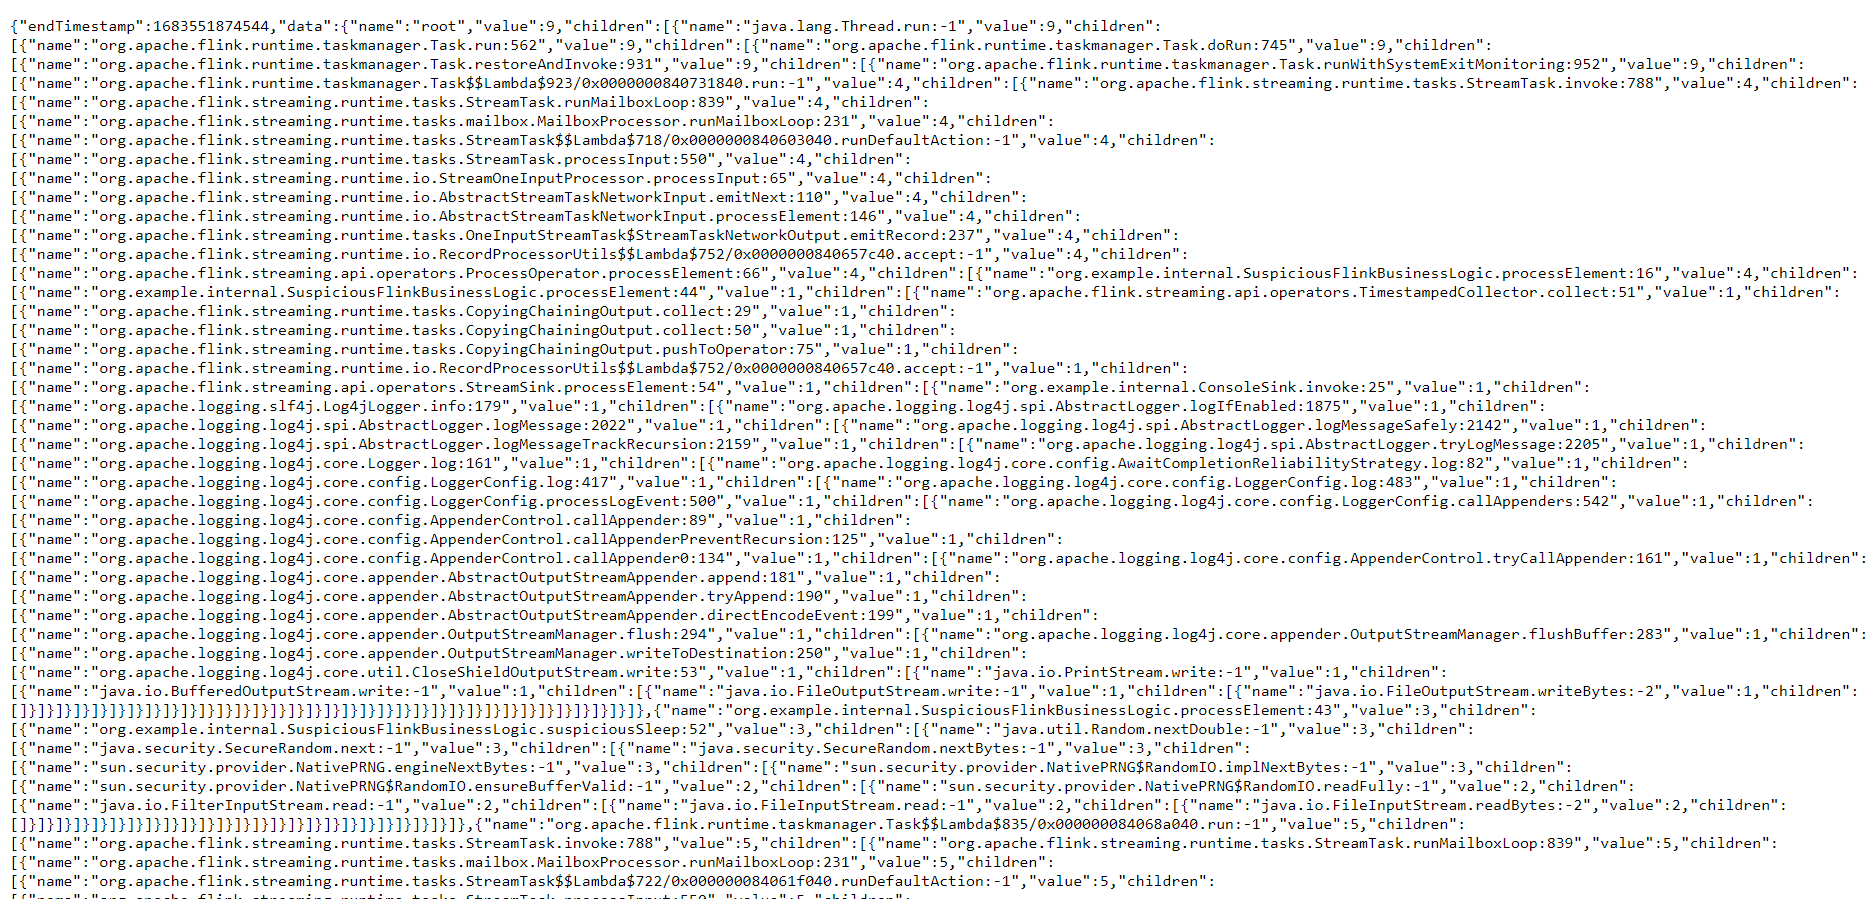
Select the entire content, then save it as a json file. What we just saved is the Flame Graph data gathered by Flink backend, preprocessed and sent to the Flink UI.
Now, when we have extracted raw Flame Graph data from Flink backend, we can use some JavaScript magic and create the graph. To this end, we will use the d3-flame-graph library.Using this library and examples from it, I’ve created a very simple page that allows you to browse exported data. To get the code, visit the PlotFlinkFlameGraphs repository where you will find the index.html.When you open the index.html in your web browser, you will see a simple UI. Click the “Choose file” button on the bottom left and select the json file created in the previous chapter. At the end you should see something similar to this:
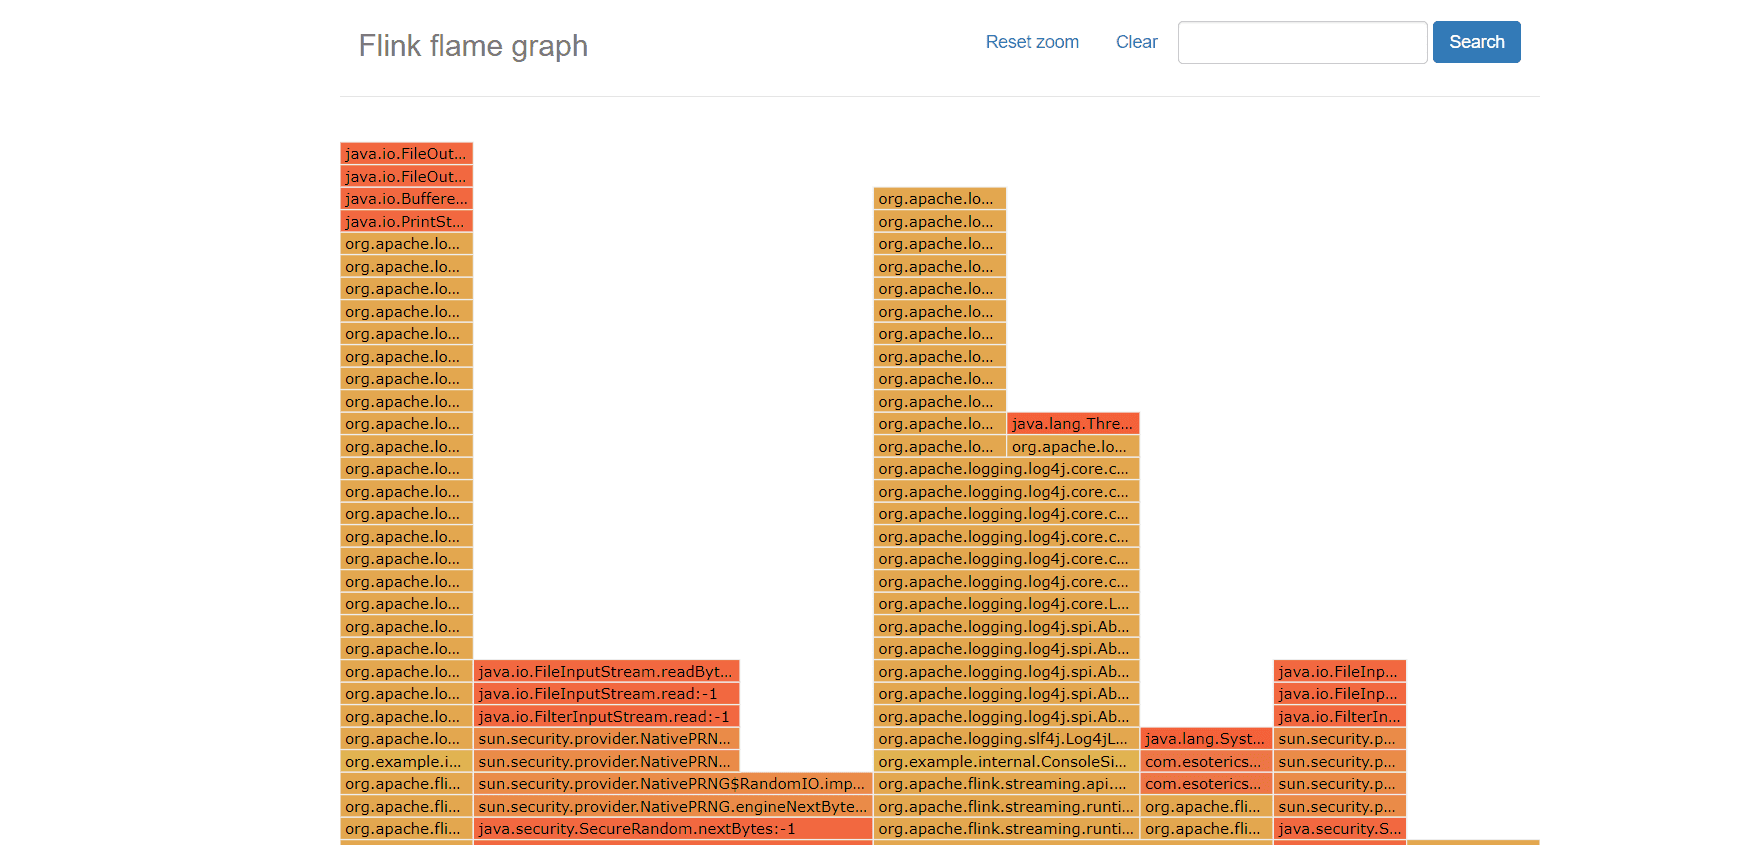
You can click on individual tiles to expand them. Click the “Reset zoom” button to return to the original view. If you wish to load new data, simply click again on the “Choose File” button at the bottom left.
Voilà, now you have a Flame Graph from Flink data that you can analyze offline.
You can play with this brilliant tool using sample data uploaded to the repository.
Can you spot what might be causing an issue in this one? Let us know in the comments ;).
Starting from Flink 1.13, we have access to a great tool for debugging Flink Job bottlenecks which is Flame Graphs. In this blog post I have shown you how you can extract data from the Flink UI and plot a Flame Graph from it for offline analysis. This solves the problem, with the Flink Flame Graph being updated during Job execution or even being no longer available after a job terminates. With our nifty javascript code, based on the d3-flame-graph library you can analyze this data whenever you want.
If you are looking at Nifi to help you in your data ingestions pipeline, there might be an interesting alternative. Let’s assume we want to simply…
Read moreThe client who needs Data Analytics Platform ING is a global bank with a European base, serving large corporations, multinationals and financial…
Read moreThe 4th edition of DataMass, and the first one we have had the pleasure of co-organizing, is behind us. We would like to thank all the speakers for…
Read moreMoney transfers from one account to another within one second, wherever you are? Volt.io is building the world’s first global real-time payment…
Read moreAs the effort to productionize ML workflows is growing, feature stores are also growing in importance. Their job is to provide standardized and up-to…
Read moreWhat is BigQuery ML? BQML empowers data analysts to create and execute ML models through existing SQL tools & skills. Thanks to that, data analysts…
Read moreTogether, we will select the best Big Data solutions for your organization and build a project that will have a real impact on your organization.
What did you find most impressive about GetInData?