Why are log analytics so important in a monitoring system?
A monitoring system is a necessary component of any data platform. We can find a lot of different services that use different approaches to the same…
Read moreCan you build an automated infrastructure setup, basic data pipelines, and a sample analytics dashboard in the first two weeks of the project? The solution that is simple, cost-effective, low-maintenance, and fully addresses the current customer needs?
Dive into the case study for Intelligent Health and check the pros and cons of this approach.
Many, if not all, companies seek to leverage one of their most valuable assets, data, and transition to a data-driven business. Data analytics plays a vital role as an enabler of this transformation. However, sometimes this process might look overwhelmingly complex. You can find full-fledged, robust solutions for building a data platform and/or enabling data analytics at data-related conferences and many online resources. You are bombarded with multiple components, services, best practices, and acronyms, making the analytics tech stack look scary. It seems so complex. How much would it cost? Who would maintain it and add new features? How long would it take to implement and deploy? And it’s not that such solutions don’t have their place on the market, because they do. The recommended architectures, and best practices are relevant. GetInData offers a robust solution, a Data Framework, that addresses all data analytics needs, ranging from data engineering, data catalogue, data security and data quality, and observability to DevOps, GitOps and BI (see GetInData Modern Data Platform - features & tools for details). Analytics is not limited to high-volume systems, petabytes of data, and big engineering teams. It is also helpful on a smaller scale. Often you don’t need or are not ready for all the possible benefits and use cases. But with the right approach, you can start small and cherry-pick the things that make the most sense for your particular use case. The best solution is a simple solution addressing your immediate needs that is scalable, robust enough, and follows best practices allowing it to painlessly grow and change. We’ve partnered with Intelligent Health to support them on their ongoing data-centric journey driving system change within their sector through data maturity.
Intelligent Health is a UK-based company whose mission is
to create resilience and improve health by connecting people to each other, their communities and their environment
It delivers campaigns, with long-lasting effects and benefits, to communities to make physical activity a way of life. One crucial area of expertise in Intelligent Health is providing actionable insights through data analytics. GetInData has worked with Intelligent Health to provide analytics dashboards for their award-winning programme, Beat the Street - a real-life game played on streets and parks across a community where residents move around to earn points and rewards, thus engaging in physical activity, connecting to place and reducing time on screens.
Beat the Street games collect data points from several sources:
Our collaboration with Intelligent Health aimed to create data pipelines that would feed analytics dashboards, leading to a better understanding of how games are played and gathering new, actionable, and useful insights. It was also essential to develop a cost-effective, maintainable solution and share big data knowledge and best practices with Intelligent Health so they could take over further development independently.
What’s worth to mention, Intelligent Health's infrastructure is on AWS, with DynamoDB as the primary operational database. However, all analytics pipelines are implemented in GCP as requested by the client. An S3 bucket with daily DynamoDB table snapshots acts as an integration point between the two clouds.
Our work with the architecture was split into a few interactions.
During our first meetings, trying to understand the scope and the analytics needs of Intelligent Health, we started with a rather general architecture proposal. Which we then refined and changed as we learned more about the use case and requirements.
The initial solution revolved around the Cloud Composer component, which orchestrated the loading of data into BigQuery and data transformations for reporting.
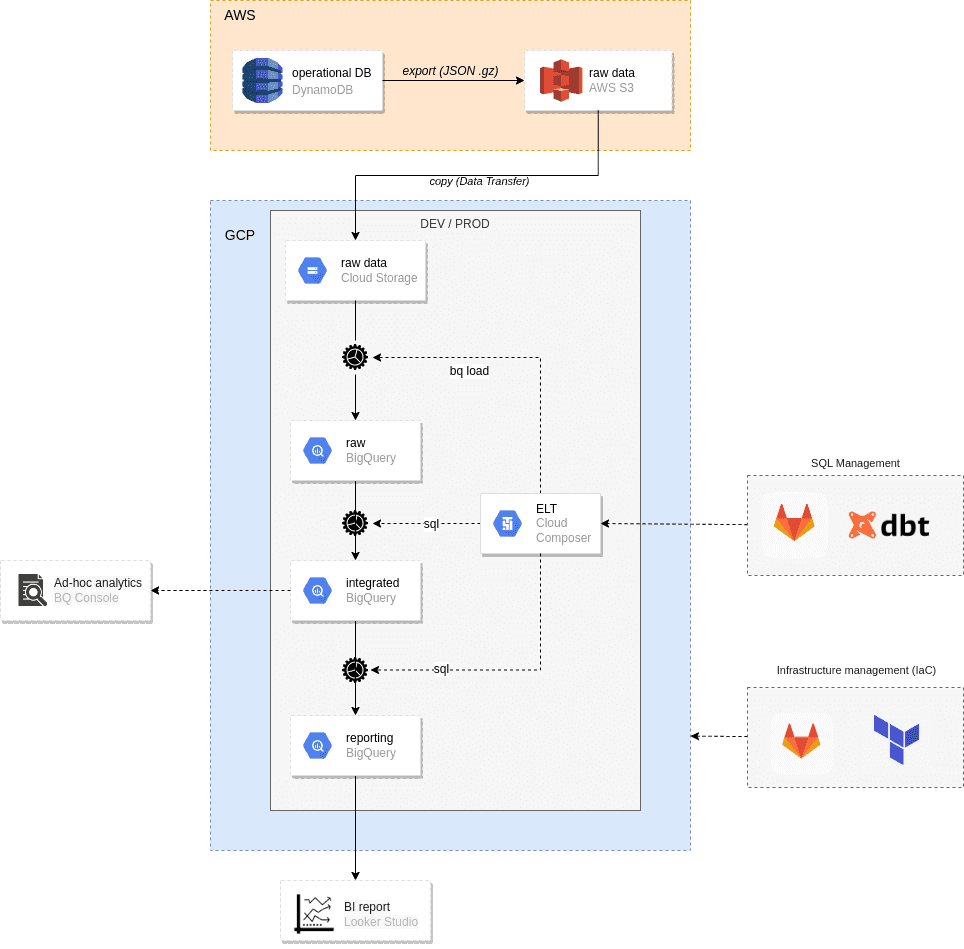
After initial discussions with the client, we quickly realised that while the initial design had many good elements, the central ELT component based on Cloud Composer was overkill in terms of functionality and cost in this particular use case. Data volumes were not particularly large, and Intelligent Health required to run the ELT process only once a day with predictable, minimal computational needs (pipelines would create BigQuery jobs - either load or query - so the main responsibility of the orchestrator would be to sequence the activities, submit jobs to BigQuery and awaiting results). Having very fine-grained control over this process, e.g., retrying individual steps, and setting up different timeouts and SLAs, was also not critical. Keeping Cloud Composer running 24/7 would be a waste, and instantiating it for a short time (which takes a long time) and destroying it after work is completed while doable would introduce unnecessary complexity and require a high level of expertise when troubleshooting.
The starting approach needed to be simpler for the use case at hand, so we decided to simplify the solution and go serverless (to minimise costs and reduce operational overhead). Initially, we contemplated an all-in-GCP solution based on a combination of Google Workflows and Cloud Build (and/or Cloud Run) services. While applicable to our workflow and orchestration needs, it was admittedly a stretch for our use case with no massive scaling requirements (However, it is a fully serverless solution worth considering when choosing a data workflow orchestrator service). Therefore, we decided to employ the client’s existing assets, i.e., Gitlab, and use CI/CD runners to run data transformations. The simplified solution consisted of just a few managed services, which are presented in the following figure.
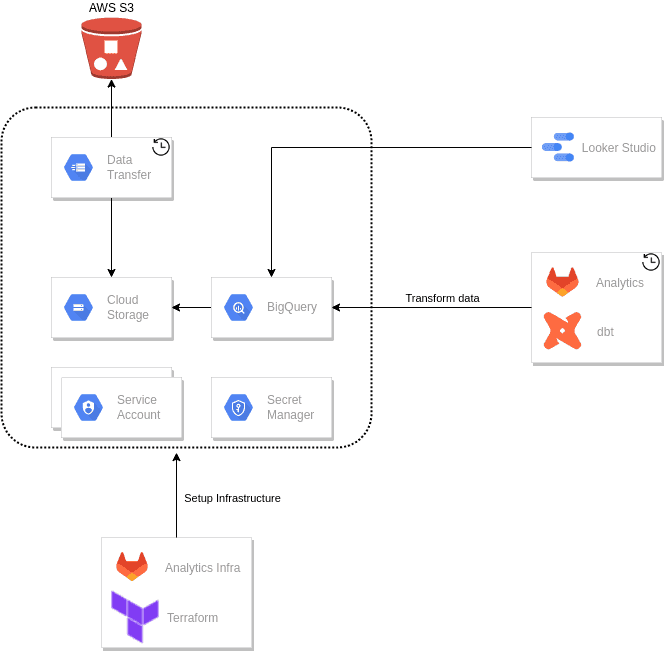
A Gitlab pipeline uses Terrafom, an open-source infrastructure as a code (IaC) software tool, which sets up most of the GCP infrastructure in an automated manner. However, we left some one-off manual steps because automating them would cost too much time with little benefits. For instance, setting up external datasets includes uploading manually to GCS some slow-changing or static public assets which are used in analytics reports, e.g., Index of deprivation (IMD) or geoJSON data. A hurdle is that some public resources require some authentication or are not in an easy to process format (e.g. Excel files). It is an infrequent action, therefore, downloading and preprocessing if needed (e.g., exporting an Excel sheet as a CSV) such files manually made sense.
There are only a few GCP components, namely GCS, Data Transfer and BigQuery, but even at this scale, we find it beneficial to have a version-controlled infrastructure setup. We also created two separate environments, dev, and prod, and having an IaC lets us apply changes to both with a single command or click (triggering a Gitlab pipeline).
Extracting data is simple. The Data Transfer service runs a daily job that transfers raw data files from AWS S3 (DynamoDB table exports in DynamoDB JSON format) to a corresponding Google Cloud Storage bucket.
We chose a popular dbt framework to load data into BigQuery. dbt is not a complete ELT tool. By default, it does not load data and focuses on T in ELT processes. A default dbt installation requires some pre-existing data sources. We store raw data in Google Cloud Storage which is not directly accessible by a standard dbt. We did not want to introduce an additional component that would load data from GCS into BigQuery. Fortunately, dbt is extensible, and we circumvented the limitation by installing the dbt-external-tables package that provides macros to create or replace external tables (BigQuery is supported). In this way, we reduced the number of components and conveniently kept the end-to-end process (Load and Transform, LT in ELT) in dbt.
We briefly considered other alternatives when evaluating the best solution for our use case. A reminder - given the scale and infrequency of ELT runs, we limited our evaluation to Serverless services only.
bq - we considered using bq load to load files from GCS into BigQuery tables first. It is a natural first choice - simple, cost-effective (you do not pay for it), and requires minimal scripting (e.g., bash or python). Ultimately, using dbt-external-package, we achieved the same goal with less effort.
BigQuery Omni - it was a newly introduced service, and at first glance, it was a good fit with multi-cloud support. A nice feature is that it provides secure access to AWS resources without the hassle of sharing API keys and computations run locally within AWS. However, you cannot easily export to native BigQuery tables, and very few locations are currently supported anyway (only US).
BigQuery Data Transfer service - it was a close call. It would have worked but wildcards/parameters support is limited and keeping everything in dbt (from raw and external tables to reporting tables) was more straightforward and more convenient.
Our data transformations are triggered by scheduled Gitlab runners. Data pipelines use dbt to transform data using just SQL statements.
Data transformations help shape data in such a way that data analysts and BI tools can easily and effectively consume it. It involves cleaning, re-casting and renaming data and pre-calculating aggregates.
The following diagram shows a data transformation pipeline employed to transform Beat the Street data.
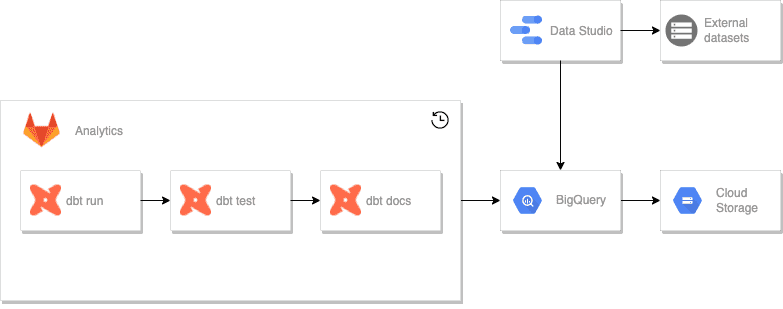
You can model your data transformations in many ways. With a relatively small project, it doesn't matter how it is done. You can go directly from raw data to reports, don't you? At a small scale, you might think, you'll rewrite everything if needed. And while a full re-rewrite may be an option, it is usually not the best allocation of your time and resources. We believe that irrespectively of the project complexity and scale, you should follow the encompassing rule of dbt projects, i.e.
the need to establish a cohesive arc moving data from source-conformed to business-conformed
Adherence to this rule allowed us to isolate changes in source data, which are often out of your control, and prevent them from cascading through all our models and reports.
Following the dbt best practices, we identified the following model categories.
Source models name and describe schemas of existing raw data sources (used by dbt-external-tables to create/replace BigQuery external tables).
External datasets name and describe schemas of external datasets. These are mostly static datasets uploaded to GCS manually or as a part of the automatic infrastructure setup. External datasets are static or slow changing. There is no point refreshing them daily (and some are quite big). We tagged such transformations and excluded them from daily runs, i.e.,
dbt run --exclude tag:externalThey can be initialised or refreshed when needed by manually triggering an optional job in Gitlab.
Staging models define intermediary datasets. Each model represents a one-to-one relationship with the corresponding source data table. It has the same granularity, but the columns have been renamed and recast into a consistent format. In our case, it is mostly just flattening and renaming the overly nested DynamoDB export data (DynamoDB JSON format). Here is a representative example of such a transformation.
with source as (
   select * from {{ source('raw', 'Player') }}
),
renamed as (
   select
       Item.id.S as id,
       Item.gameId.S as game_id,
       Item.isRegistered.BOOL as registered,
       Item.isVerified.BOOL as verified
   from
       source
)
select * from renamed
The initial source data was quite consistent in this regard. However, as the project progressed, some of the table exports have changed. For those few tables, instead of relying on an automatic DynamoDB export which results in data in DynamoDB JSON format, a backend team decided to implement a custom Lambda function that would export data already flattened. Having this staging layer allowed us to easily accommodate such changes, keeping them isolated and consistent with our naming convention. Staging models use view materialisation by default.
Intermediate models represent datasets that combine staging models or perform intermediate transformations. These models are used to materialise intermediary tables used in multiple places or keep shared transformations. Reporting models later use the output of these models. Finally, if needed, they use table materialisation for better query performance.
Reporting models represent datasets to be used by clients (users or BI tools). We wanted to avoid having complex transformations in Looker Studio as it lacks the means to track and review such transformations, and the visibility of such code is poor (to see any custom transformation or projection, you need to go to a specific widget or field and click it). The general idea is to combine, aggregate, and calculate data using dbt. The resulting reporting datasets are then easily consumed by Looker Studio with only some minimal projections and aggregations. This way, we can keep data transformations version-controlled, which are easy to track and review. Reporting tables use table materialisation for better query performance.
Our project structure directly reflects the categories listed above.
├── dbt_project.yml
└── models
    ├── external
    ├── reporting
        └── intermediate
    ├── sources
└── stagingdbt can generate documentation for the project with tables information and data lineage. We publish the generated documentation to Gitlab Pages, again reusing the existing client’s infrastructure.
The final selection of data transformation tools is satisfactory. However, there are some valid alternatives you may pursue.
Dataform - shortly before the project began, Google acquired Dataform. Unfortunately, it was unavailable in the GCP offering (it is in Preview at the time of writing this blog post). However, it has a similar feature set to dbt, and if you have already invested in GCP it is just as good a choice.
There is also the third chapter of our story. After the initial MVP we sparingly continued to help Intelligent Health add more reports and charts or fix some issues. These were just minor changes or additions, but one change stands out - we were asked to accommodate a single table design. A team providing applications to Intelligent Health decided to migrate their solution from a multi-table to a single-table design (Some performance issues were identified as the motivator. More on the single table design concept can be found in this blog post - Amazon DynamoDB - single table design).
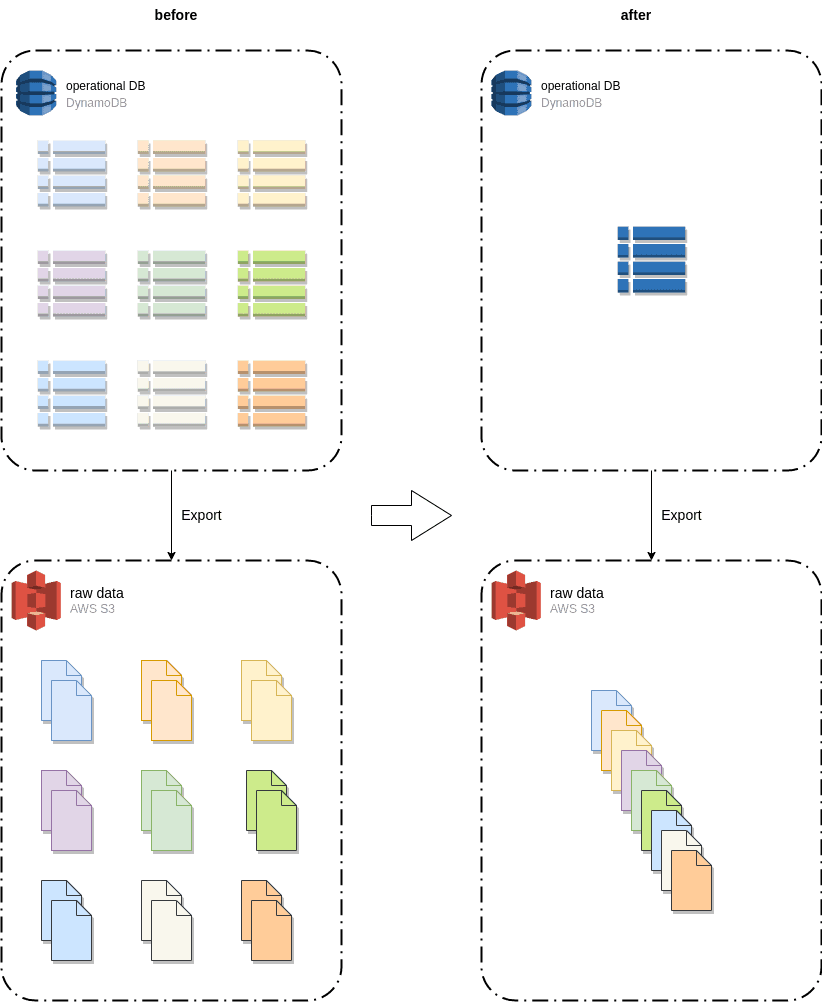
On the analytics side, the change was not a big deal. When we had carefully designed, and separated models, the external tables and staging models were the only places we had to apply some changes. The Intermediate and reporting tables remained intact, containing the main, sometimes complex, data transformations. Therefore we also didn't have to modify any Looker Studio reports. In addition, the new source data schema simplified external table definitions - reduced to a single table.
Given the single table design in the source system, we were to receive newline delimited JSON files with heterogeneous entities. BigQuery requires a strict schema and cannot accommodate such a use case. Or can it? Well, it would not be possible to load data in JSON format. However, we can trick BigQuery into loading everything without any issues by just treating those JSON files as CSV files (Be careful when choosing a delimiter. It should not be present in data. In our case, an invisible character, \x1B, or Esc, worked fine). We ended up with a single, string-type column with a JSON body as a value. Then, staging models had to filter out specific entities and extract values using JSON functions. For example:
with source as (
    select
        *
    from
        {{ source('raw', 'MainTable') }}
    where
        starts_with(json_value(raw_json, '$.PK'), 'PLR#')
        and json_value(raw_json, '$.SK') = 'PRF'
),
extracted as (
    select
        json_value(raw_json, '$.PK') as pk,
        json_value(raw_json, '$.gameId') as gameId,
        json_value(raw_json, '$.isVerified') as isVerified
    from
        source
),
renamed as (
    select
        pk as id,
        gameId as game_id,
        safe_cast(isVerified as bool) as verified
    from
        extracted
)
select * from renamed
The entire migration to the new model took only 3 days.
Looker Studio (formerly Data Studio) was selected upfront as a reporting tool. It is free and nicely integrates with other Google services. Looker Studio is used to turn data into dashboards and reports. It operates mainly on BigQuery tables prepared by the data engineering pipelines. In a limited number of cases, we also take advantage of data blending, i.e., combining data from multiple data sources. For example, we join BigQuery tables with Google Sheets documents. These are usually some dictionaries, such as a school list, or some settings, such as anticipated game targets. Users can easily edit such files using a familiar interface.
For any ad-hoc analytics users can go directly to the BigQuery console and query raw data or predefined aggregates.
The MVP lasted about 6 weeks and the bulk of the time was spent on preparing reporting data (dbt transformations) and dashboards (about dozen pages in the initial dashboard). The automated infrastructure setup, basic data pipelines and a sample report were delivered in the first 2 weeks, including detours to find the best-fitting solution. On GetInData’s side, it was basically one data engineer full-time effort with accompanying project management support and initial Cloud Architect involvement.
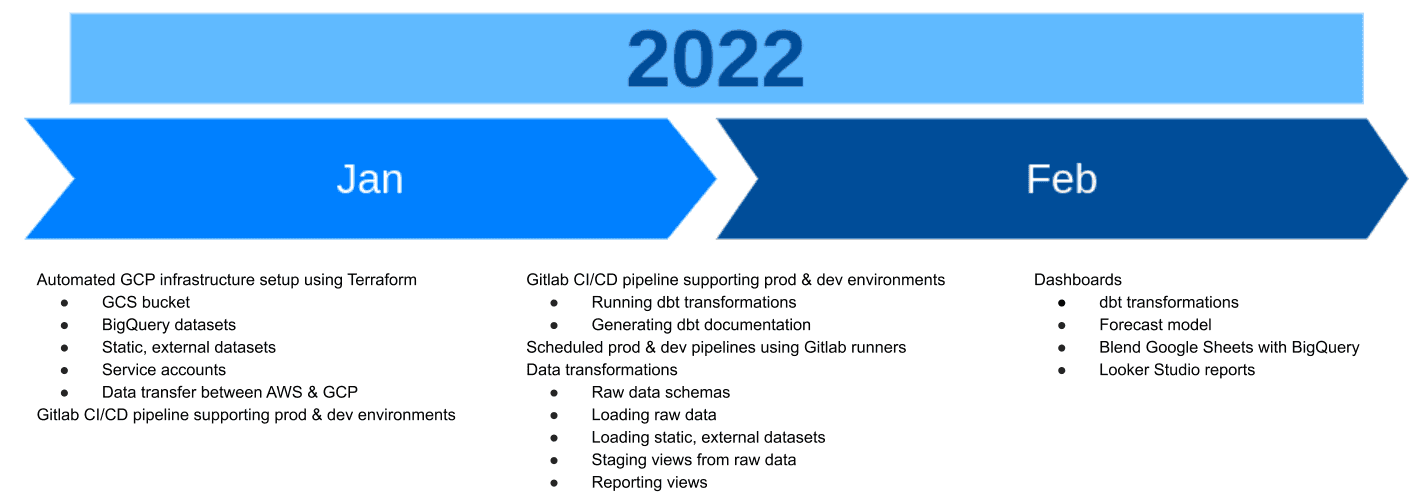
Afterward, we changed the way of working with Intelligent Health to an agile, on-demand collaboration.
Software engineering is full of tradeoffs. There is no silver-bullet solution that addresses everything without some caveats, trade offs, or limitations. Having worked on the project and lived with the decisions made, here is a list of some pros and cons of the components we used. Even if your use case, requirements, or priorities differ, you may find our findings helpful.
We’ll start with the end-user-facing component, Looker Studio, a free yet capable tool. Being a zero-cost tool is a huge advantage (just be aware that zero-cost is only the tool. You will incur costs of using, for instance, BigQuery, if you exceed free tier limits). Being free, in this case, does not mean it lacks any fundamental features. We’ve successfully delivered most of the requested reports using just default widgets and controls. From the authoring point of view Looker Studio is intuitive and easy to use. You just connect a data source and drag and drop visualisations and controls. It also integrates nicely with other Google-managed services, not a surprise, but also with non-Google services. We’ve heavily used data source blending between BigQuery and Google sheets.
However, it has its limitations. One thing we didn’t like is that you need to click everything out. Maintaining multiple environments and therefore multiple dashboards was cumbersome, time consuming and impractical - every datasource and report needed to be created manually. Only the very first promotion of a dashboard from development to production was fairly easy - you just copy the dashboard and change data sources (a good naming convention helps). But migrating later changes was painful. In fact, it would be easier to copy the entire dashboard and change data sources again. Unfortunately, this would involve sharing a different link to the new dashboard. Similarly time consuming and tedious was setting up access to data sources and reports. As stated earlier, default widgets and controls were enough to deliver acceptable reports. However, it was mostly because Intelligent Health took the limitations of the tool for granted and didn’t expect nor require any custom implementation (Looker Studio allows implementing your own visualisations or controls and using third party components, but keep in mind security!). For example, some of the map components should ideally have multiple overlays, a feature not available in the standard library. Lastly, although the reports are versioned you can really only time travel, tracking and reviewing the actual changes is not possible.
The central component of the solution is dbt, and we are very happy with that tool. The entry level is low, and the learning curve is minimal - most of the time is just plain, old SQL, sprinkled with some templating and, in our case, BigQuery-specific functions and constructs. We've used only basic dbt features. Our data transformations, although sometimes complex, didn't require any custom macros or more advanced features. But we did benefit from code/snippet reusability. The extensible nature of dbt allowed us to use the external-table package and keep the load part also in dbt. The automatic documentation and data lineage are a nice addition as well. In our simple scenario, it is hard to find any serious limitations. One may argue that the way we run dbt transformations, by simply executing the dbt run command in a Gitlab runner, lacks fine-grained control over the process. We cannot easily re-run a single transformation as it would be the case if we used, for instance, airflow and dbt to airflow plugin. However, in our case, it is sufficient. Firstly, we didn't have such a requirement. Secondly, at our scale and data volume, data processing is fast, and re-running the whole process is good enough. Note, that from dbt 1.0 it is possible to run jobs from failure, e.g.
dbt run –select result:error+ –defer –state <prev_state>We haven't used any advanced tool for scheduling and orchestrating our ELT pipelines. Intelligent Health used Gitlab as their source code repository. And we just used Gitlab built-in features, i.e. scheduled pipelines and failure notifications (email and slack). Most of the time this approach is zero-cost as we usually don't consume more than 400 minutes monthly (Gitlab free minutes threshold). The thing we don't like is putting GCP service account keys in CI/CD variables. However, this issue should be addressed soon with Gitlab with Google Wordkload Identity integration which is currently in progress.
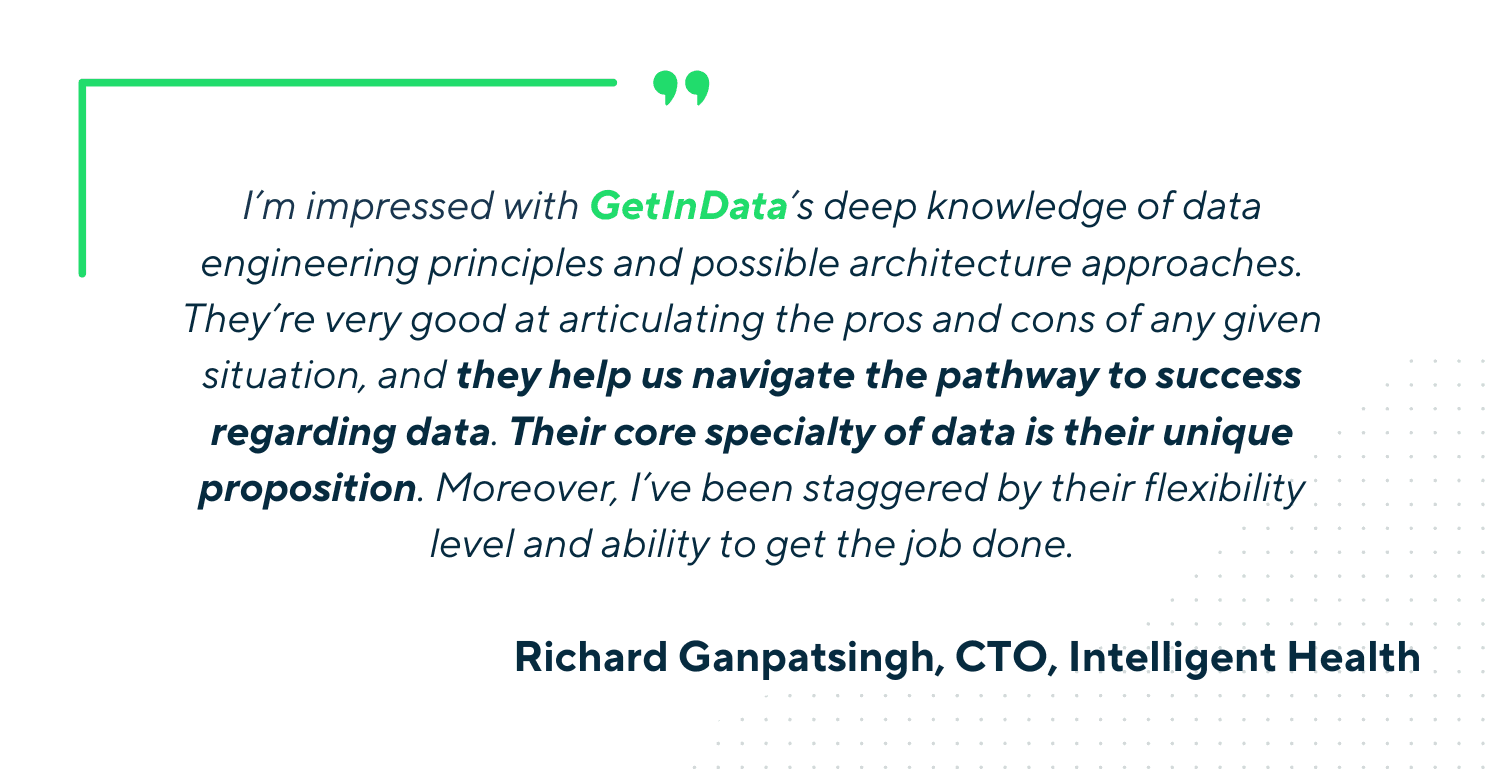
We've built with Intelligent Health a simple, cost-effective, low-maintenance solution that fully addresses their current needs and is easy to change or expand if needed. It was a multi-step process. We started off with an initial proposal which, after discovering the scope and operational requirements, we trimmed down and adjusted to limit any accidental complexity. Although we didn't use the Data Platform, our extensive knowledge and expertise in Big Data and the data analytics landscape helped us quickly identify viable tools and services that could be tailored to the client's needs. The result was simple yet robust enough to accommodate even a major change in the source data with minimal time and effort.
The collaboration is ongoing with GetInData’s occasional help in fixing issues or adding new reports.
Do not hesitate to contact us or sign up for a free consultation to discuss your data analytics needs. Our team is ready to build a Modern Data Platform for you in a few weeks.
A monitoring system is a necessary component of any data platform. We can find a lot of different services that use different approaches to the same…
Read moreIntroduction In the ever-evolving world of data analytics, businesses are continuously seeking innovative methods to unlock hidden value from their…
Read moreOne of the main challenges of today's Machine Learning initiatives is the need for a centralized store of high-quality data that can be reused by Data…
Read moreIn data engineering, poor data quality can lead to massive inefficiencies and incorrect decision-making. Whether it's duplicate records, missing…
Read moreReal-time data streaming platforms are tough to create and to maintain. This difficulty is caused by a huge amount of data that we have to process as…
Read moreMy goal is to create a comprehensive review of available options when dealing with Complex Event Processing using Apache Flink. We will be building a…
Read moreTogether, we will select the best Big Data solutions for your organization and build a project that will have a real impact on your organization.
What did you find most impressive about GetInData?