Why do Big Data projects fail? Part I. The Business Perspective.
In a recent post on out Big Data blog, "Big Data for E-commerce", I wrote about how Big Data solutions are becoming indispensable in modern business…
Read moreA monitoring system is a necessary component of any data platform. We can find a lot of different services that use different approaches to the same thing, and all of them provide quite similar features and work reliably, which is most important. Moreover, there is also an opportunity to take advantage of reading logs. This is a really useful feature when debugging an issue in an application or check what is happening on your platform. How can this be achieved?
We need to start with some questions to explain why and for what monitoring systems with log analytics can be useful. The first thing is about performing complex monitoring of each process in our platform. When talking about Big Data solutions, it is imperative to check that all real-time processing jobs work as expected, because we have to act quickly if there are any issues. It is also important to validate how any changes in the code help in the processing part.
Here we can talk about processing jobs that run on Apache Spark and Apache Flink. The first part of the monitoring process is focused on getting metrics like the number of processed events, JVM statistics or used Task Managers. The second is about log analytics. We want to detect any warnings or errors in the log files and analyze them later during post mortem or to find any invalid data sources. Moreover, we can set up alerts based on the log files that could be really helpful for detecting issues, even with a different component.
There is also a need to provide all log files in real time, because any lag in sending them can cause problems and would not provide the required effect for IT and business developers. In the case of a Flink job, we want to check that all triggers work as expected, and if not then we would need to find the reason for this in the log files. We want to find values in logs later by looking for an exact phrase.
There are several solutions on the market, and we have tried many different approaches to finding the one tailored to the needs of the service.
The most common solution when talking about log analytics is Elastic stack. We can use ElasticSearch for indexing, Logstash for processing log files that are sent by Filebeat or Fluentd from machines directly and Kibana for data visualization and alerts. It is a really mature and well-developed platform where you can find a lot of plugins.
It is a great solution for indexing logs for business developers when you have to index all the content of log files. We also need to remember about technical requirements. You can tune up the parameters, but it still requires a great amount of CPU and RAM to run everything smoothly.
We had Elastic stack in one project. We had Filebeat, Logstash, ElasticSearch and Kibana and we were not able to make it faster, even after implementing some changes. The overall performance was not the best and we therefore started searching for a more powerful solution. Our case was focused on getting logs from Flink jobs and NiFi pipelines because we wanted to check what was inside their logs and find some target values in the historical data.
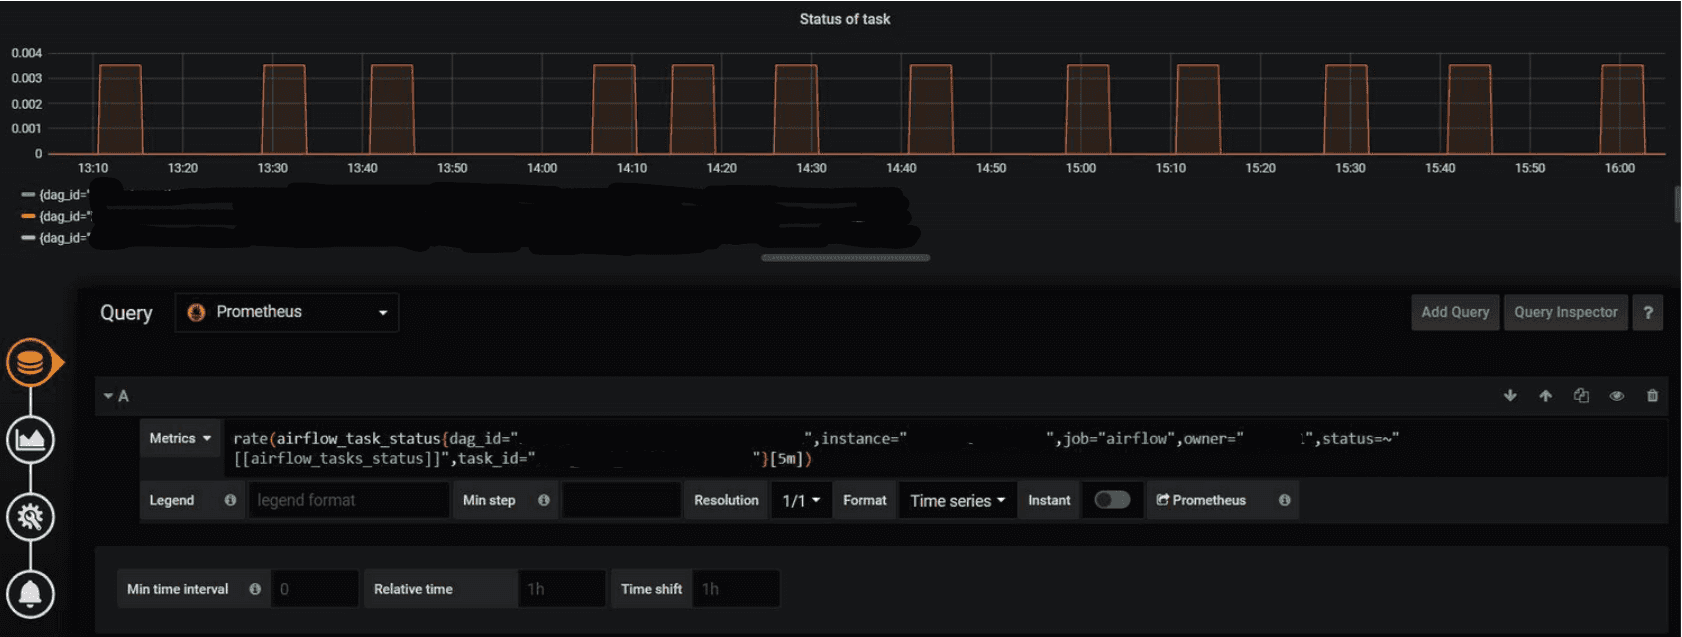
We have a monitoring system based on Prometheus and Grafana. We started by searching for available solutions that would provide better performance, and we could add log analytics in the Grafana directly.

Then we decided to test Loki. It is a horizontally-scalable, highly-available, multi-tenant log aggregation system inspired by Prometheus. It is designed to be very cost effective and easy to operate. It does not index the contents of the logs, but rather a set of labels for each log stream. The project was started in 2018 and was developed by Grafana Labs so, as you may expect, we can query Loki data in Grafana, which happens to be very useful.
We started migration from ELK to Loki stack on development environment in one project, staying with two simultaneously working log analytics tools The first great thing about Loki is the simple configuration file. The second is about the overall simplicity of the installation process. We prepared Ansible roles for Promtail and Loki installation, and added some Molecule tests that could be implemented easily.
We decided to implement the Loki-based solution on the production environment where we process over several hundred thousand events per second, so it was the best place to test it with huge, real-time data processing pipelines. The overall experience was great, because Promtail and Loki can handle all the traffic and we can deliver all the log files in near real-time with no data loss, which is crucial.
Promtail can be installed on any server and can also be easily installed on the Kubernetes pods. We can run some relabeling on the machine directly or use regex for reducing the number of sent log files. This shows that we can adjust Promtail to suit our needs.

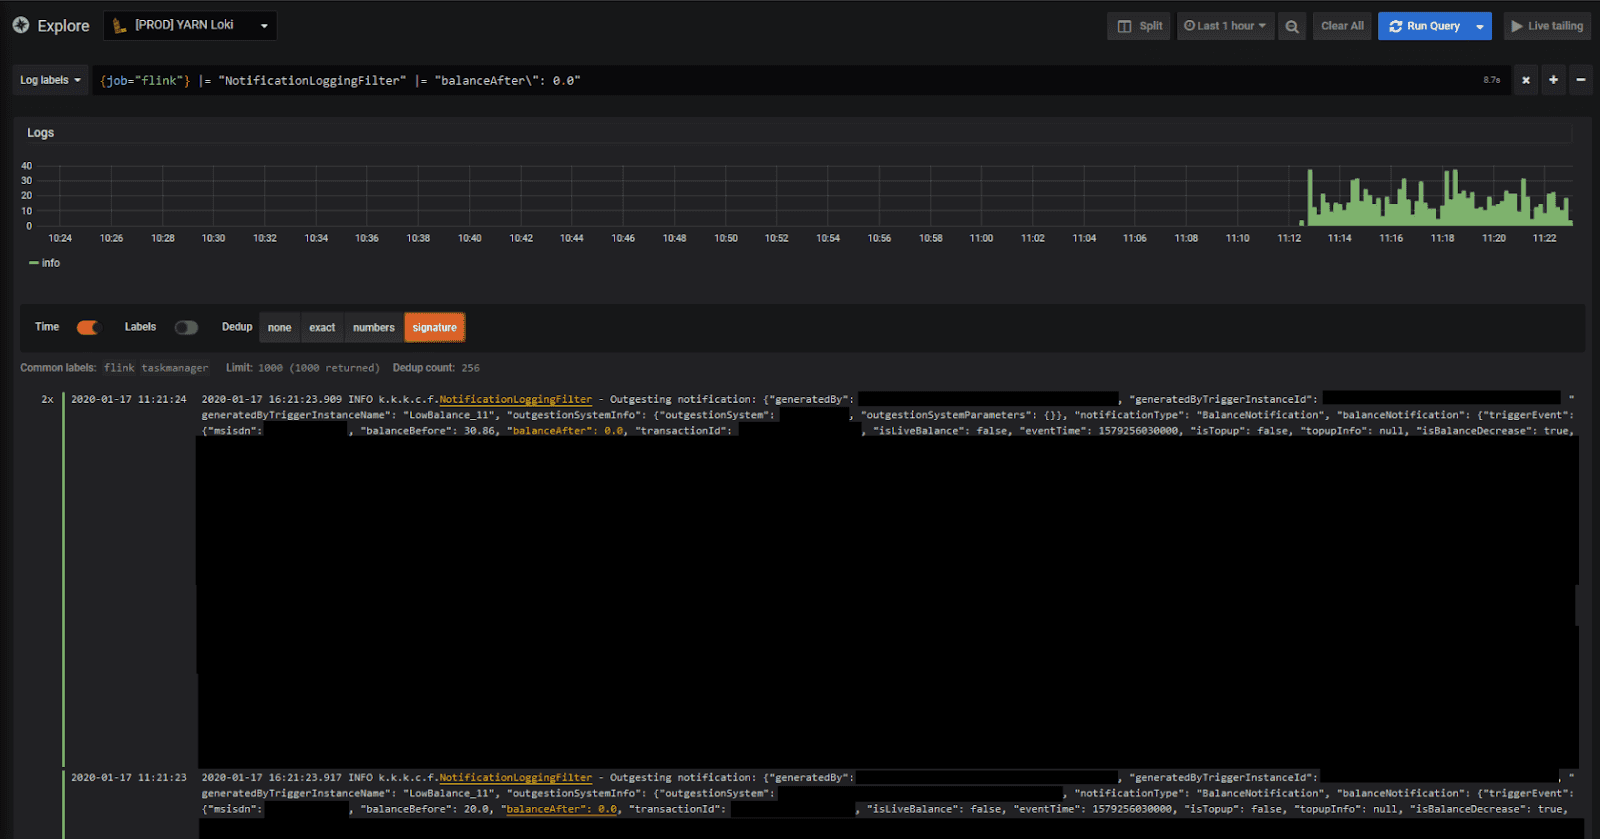
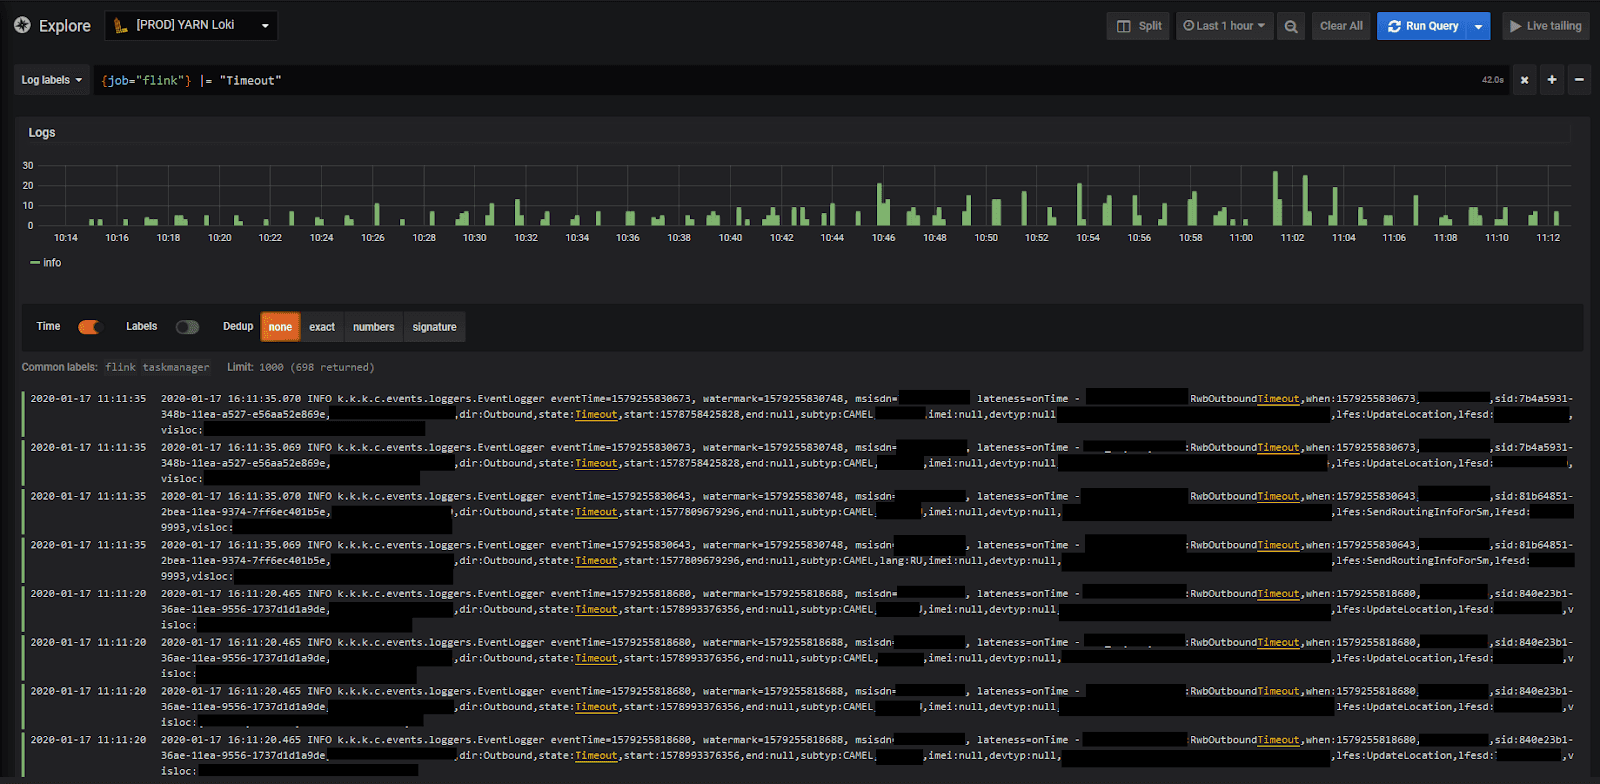
Loki provides LogQL for running queries on logs. It is really useful that its syntax is similar to PromQL, so most users can run queries with no issues. Moreover, Grafana supports adding panels that are based on the number of searched phrases in logs, which can be helpful as we can subsequently add alerts for it too. This feature is really welcomed by all kinds of developers, because they can find any relationships between metrics and the content of the log files in the dashboard in one tool, making work really efficient.

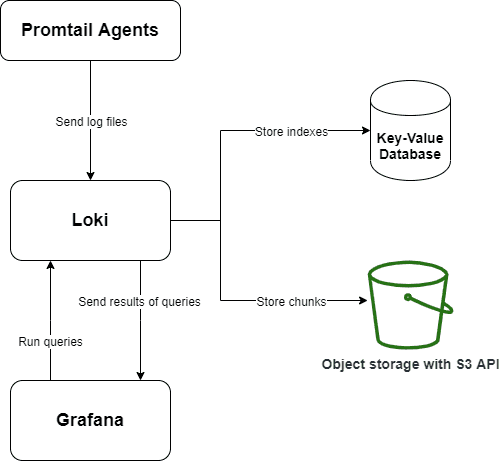
What about high availability? A default setup can be installed on the virtual machine and all data can be saved locally. It is the most basic configuration and if we want to provide high availability, we need to set up S3 storage (storing chunks) and a key-value database (storing index) like Cassandra. Here we can use Google Cloud Storage with Google BigTable or Amazon S3 with Amazon DynamoDB.

A monitoring system is a must in any data platform or any different IT service. It provides knowledge about a current situation with processes, and any issues can be resolved automatically. We can trigger some actions in case of problems, like restarting a Flink job if it is down based on the metrics that shows the number of Task Managers, for example. If not, then we would get an alert. As described in the book called Site Reliability Engineering:
‘Alerts signify that a human needs to take action immediately in response to something that is either happening or about to happen, in order to improve the situation’.
We can make our platform more stable and we can check how our enhancements work in development, staging and production environments by only taking a look at one tool. This is great for administrators and developers.
In a recent post on out Big Data blog, "Big Data for E-commerce", I wrote about how Big Data solutions are becoming indispensable in modern business…
Read moreA few months ago I was working on a project with a lot of geospatial data. Data was stored in HDFS, easily accessible through Hive. One of the tasks…
Read moreIn this episode of the RadioData Podcast, Adama Kawa talks with Alessandro Romano about FREE NOW use cases: data, techniques, signals and the KPIs…
Read moreYou could talk about what makes companies data-driven for hours. Fortunately, as a single picture is worth a thousand words, we can also use an…
Read moreThe 8th edition of the Big Data Tech Summit is already over, and we would like to thank all of the attendees for joining us this year. It was a real…
Read moreIn this episode of the RadioData Podcast, Adama Kawa talks with Jonas Björk from Acast. Mentioned topics include: analytics use cases implemented at…
Read moreTogether, we will select the best Big Data solutions for your organization and build a project that will have a real impact on your organization.
What did you find most impressive about GetInData?