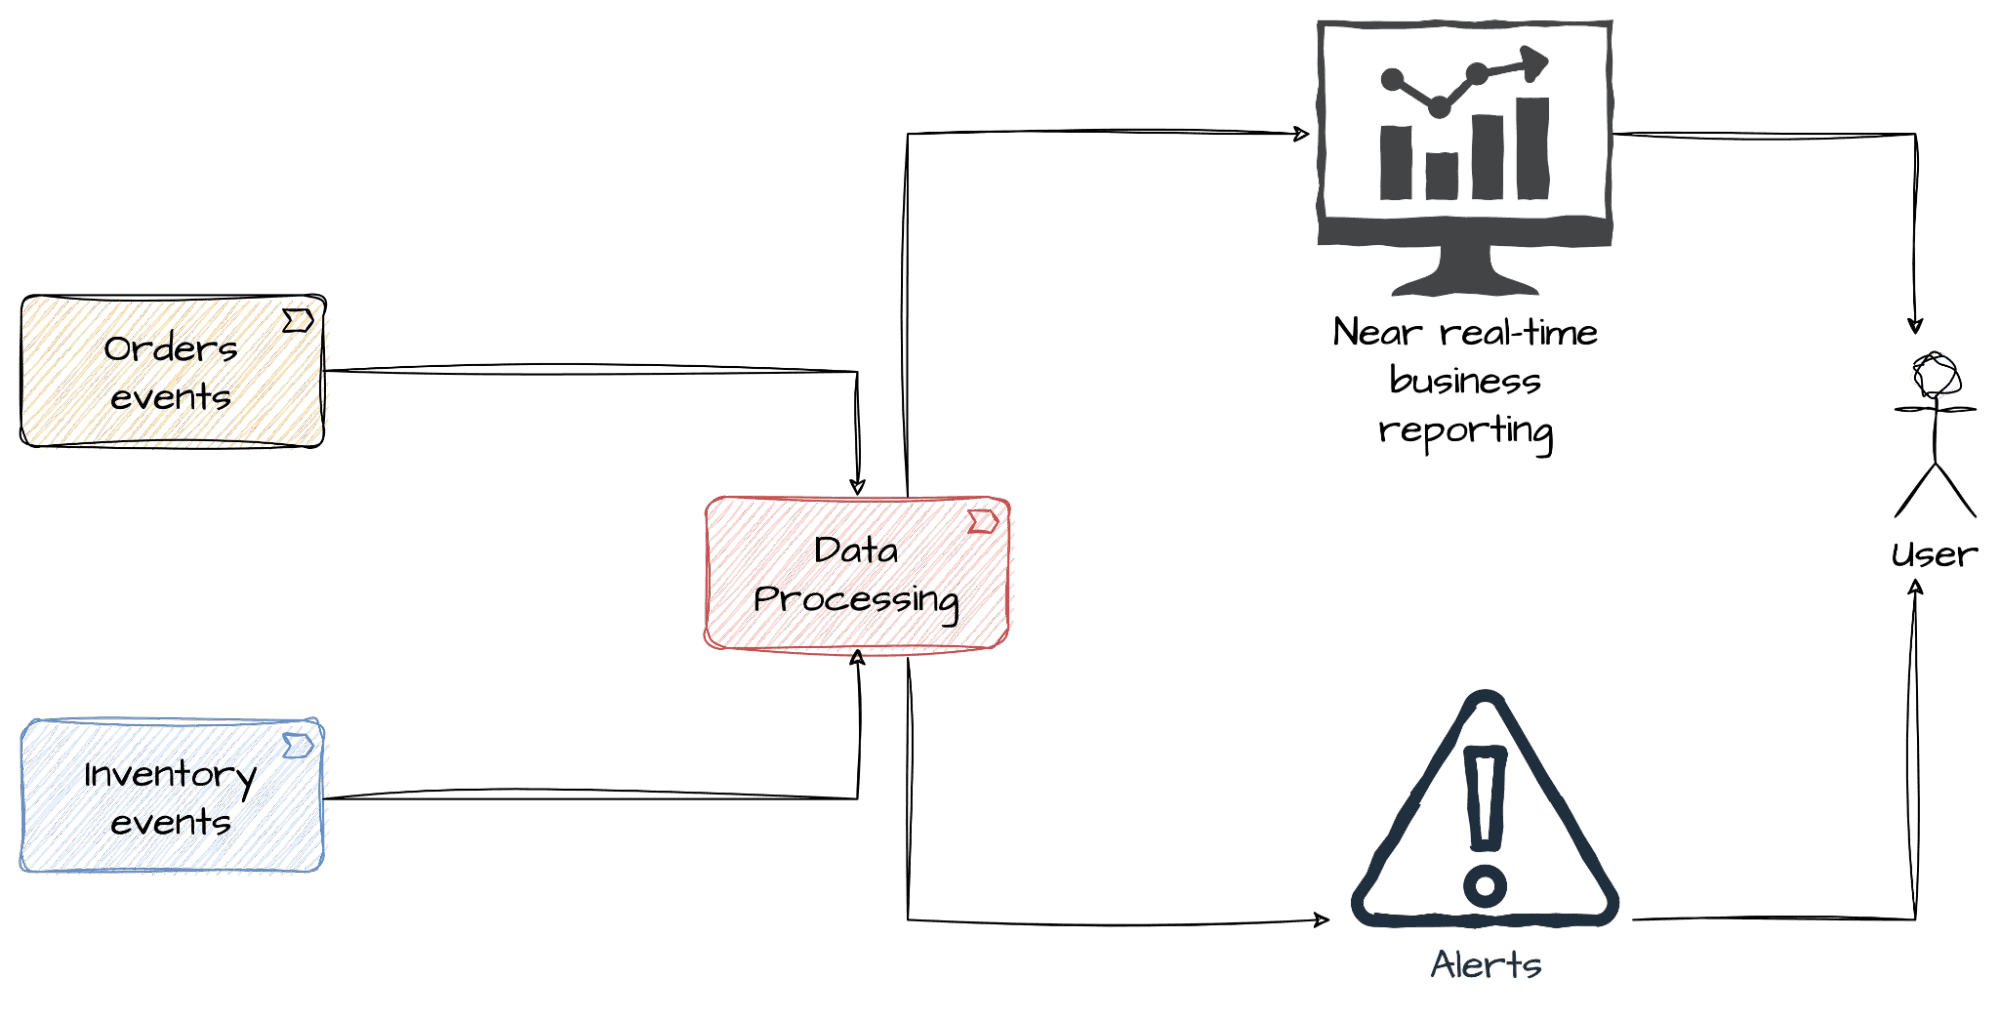
Black Friday, the pre-Christmas period, Valentine’s Day, Mother’s Day, Easter - all these events may be the prime time for the e-commerce and retail industry. Sales, discounts, promotions, products, and sets for special occasions… This means masses of operations, revenue and, as a consequence, incoming data. What if analyzing this data in real-time would help further scale sales and give you the ability to instantly adjust your strategy and business decisions based on events, and changes in user behavior? In this blog post we will show you how to use two novel Snowflake features: Snowflake Dynamic Tables & Snowflake Alerts together with dbt for near real-time analytics and data observability. You will also find out how much it will cost you.
Introduction: near real-time analytics with Snowflake Dynamic Tables & Snowflake Alerts
Building data pipelines on top of Snowflake with dbt as a data transformation tool has become an industry standard. This has founded a lot of applications in different industries for batch data processing. However, in this highly competitive environment, there is an increasing number of use cases where generating data insights in near real-time is crucial in order not to miss any business opportunities or make sure you provide a great level of service to your customers. With a recent advent of Snowflake Dynamic Tables, Alerts & Notifications as well as Streamlit for Snowflake, building reliable, near real-time data pipelines & associated data products has become easier than ever before - especially if we consider how this could be nicely integrated into an existing dbt-based data stack.

*Disclaimer: some of the Snowflake features described in this blog post (like Snowflake Dynamic Tables and Streamlit in Snowflake) are still in Public Preview at the time of writing, so please take into account that the way how they work can change at any time.*
Business scenario: near real-time analytics during Black Friday in e-commerce
Let’s imagine you are an Analytics Engineer at an online retail store. Black Friday and a very intensive holiday season is approaching, so you were asked by your business stakeholders to provide real-time insights into the sales and inventory data, so that they could react fast to what is going on. Apart from watching how the numbers change during the day, it’s also crucial for them to be alerted right away when something happens in the data that requires an immediate business action. Obviously, accurate decisions can be made based on the data you trust - this is why knowledge about the quality of the data streams is also of utmost importance.

Our retail data model
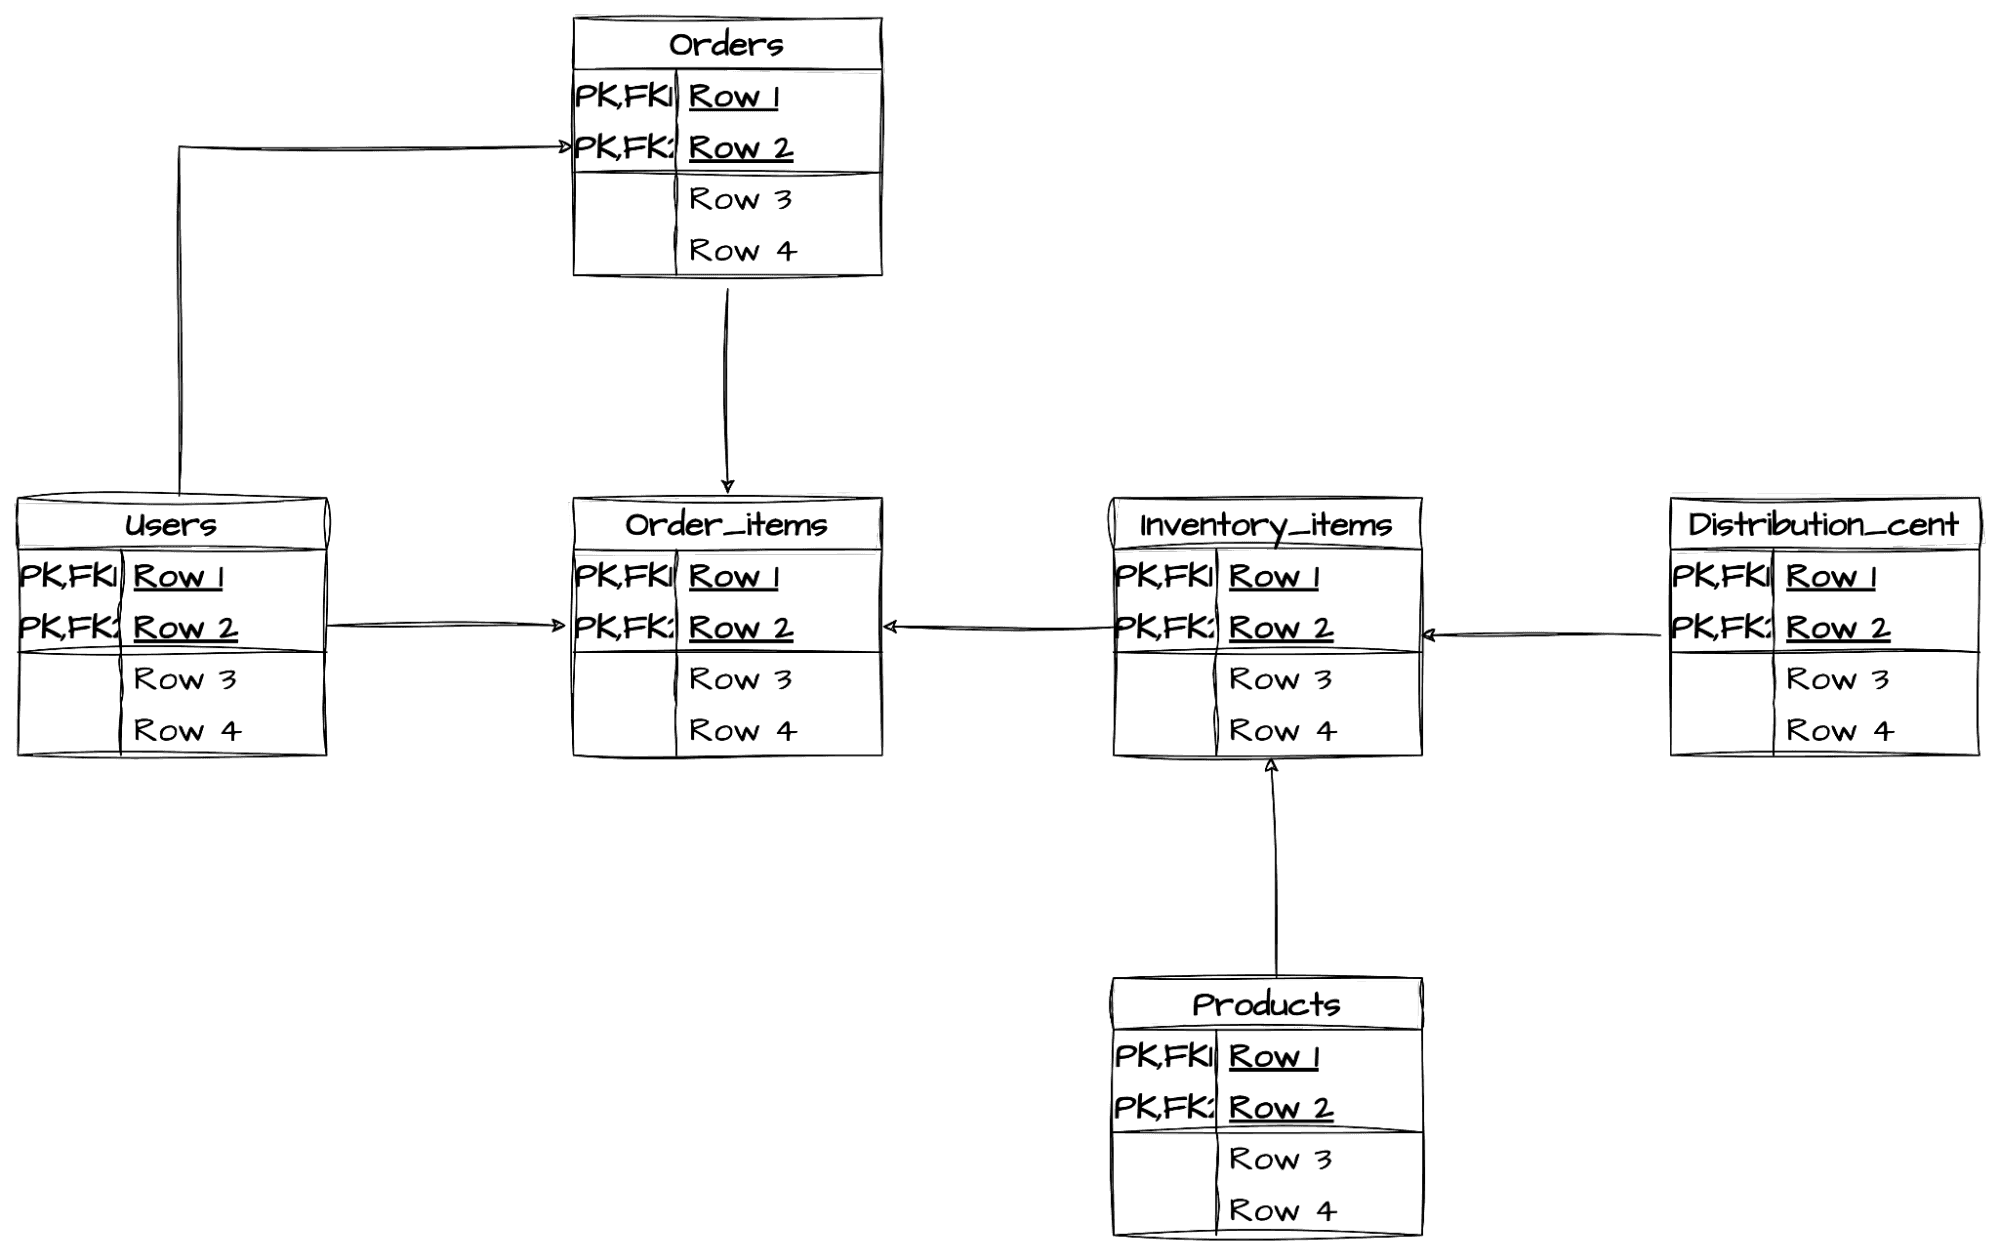
The data that we used for the demo of the end-to-end solution is based on the popular theLook eCommerce dataset that was transformed into a streaming data source that mimics Debezium JSON messages, published to table-corresponding Kafka topics. Thanks to this approach we can process and analyze all the standard e-commerce events (orders, inventory changes) in a near real-time manner.

High level architecture: e-commerce data platform

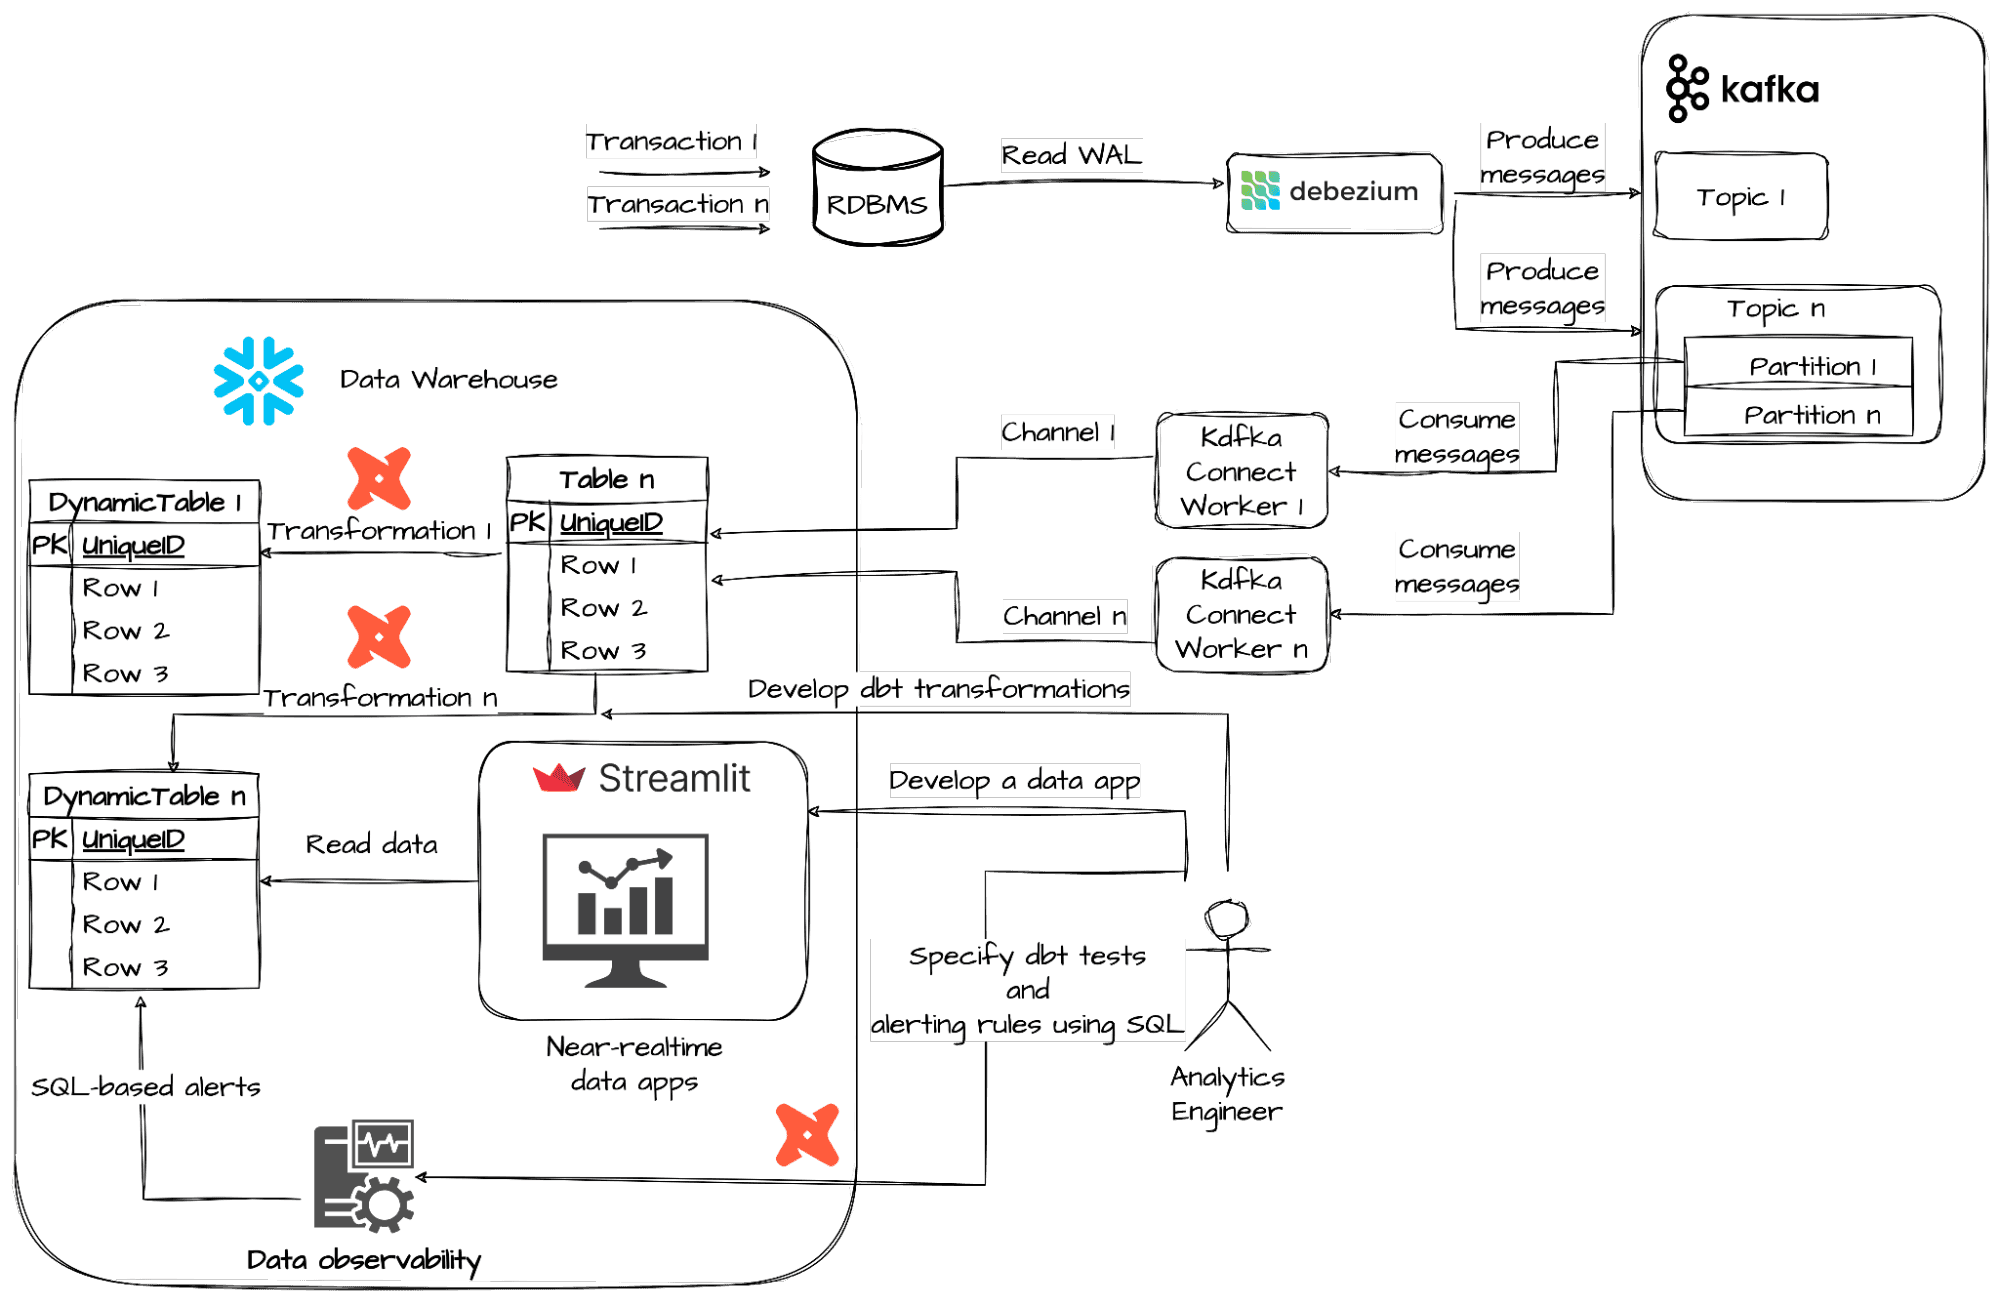
The diagram above shows the architecture of our e-commerce data platform, together with the data flow from the classic relational database management system (RDBMS), such as Oracle, SQL Server or PostgreSQL to Snowflake Data Cloud. Transactions in the source database are read from Write Ahead Logs (WALs) by a dedicated Debezium Connector following a design pattern called Change Data Capture (CDC) and transformed into messages published to a Kafka cluster. Each table from the underlying Online Transactional Processing (OLTP) database maps to a separate Kafka topic. CDC messages are directly ingested into staged tables using Kafka Connect with an official Snowflake plugin. The data transformation operations are implemented with Dynamic Tables (Public Preview feature) and dbt with its recently announced support for Materialized Views (MVs), (not to be confused with Snowflake MVs that is a different concept). No data pipeline can ever be called complete without a proper testing mechanism for the Data Quality assessment in place. The recent 1.7 release of dbt has introduced a new feature for test results materialization in the form of a view that is especially useful in the case of data streams testing. Combined with new data-oriented Snowflake Alerts and Notifications functionality, this can help us to set up a really easy yet robust Data Observability solution. Finally, the Streamlit (Public Preview feature, AWS only) application is showcased to provide data analysts with a near real-time dashboarding experience. The following subsections will cover some configuration details of the presented architecture.
Near real-time data ingestion with Snowpipe Streaming
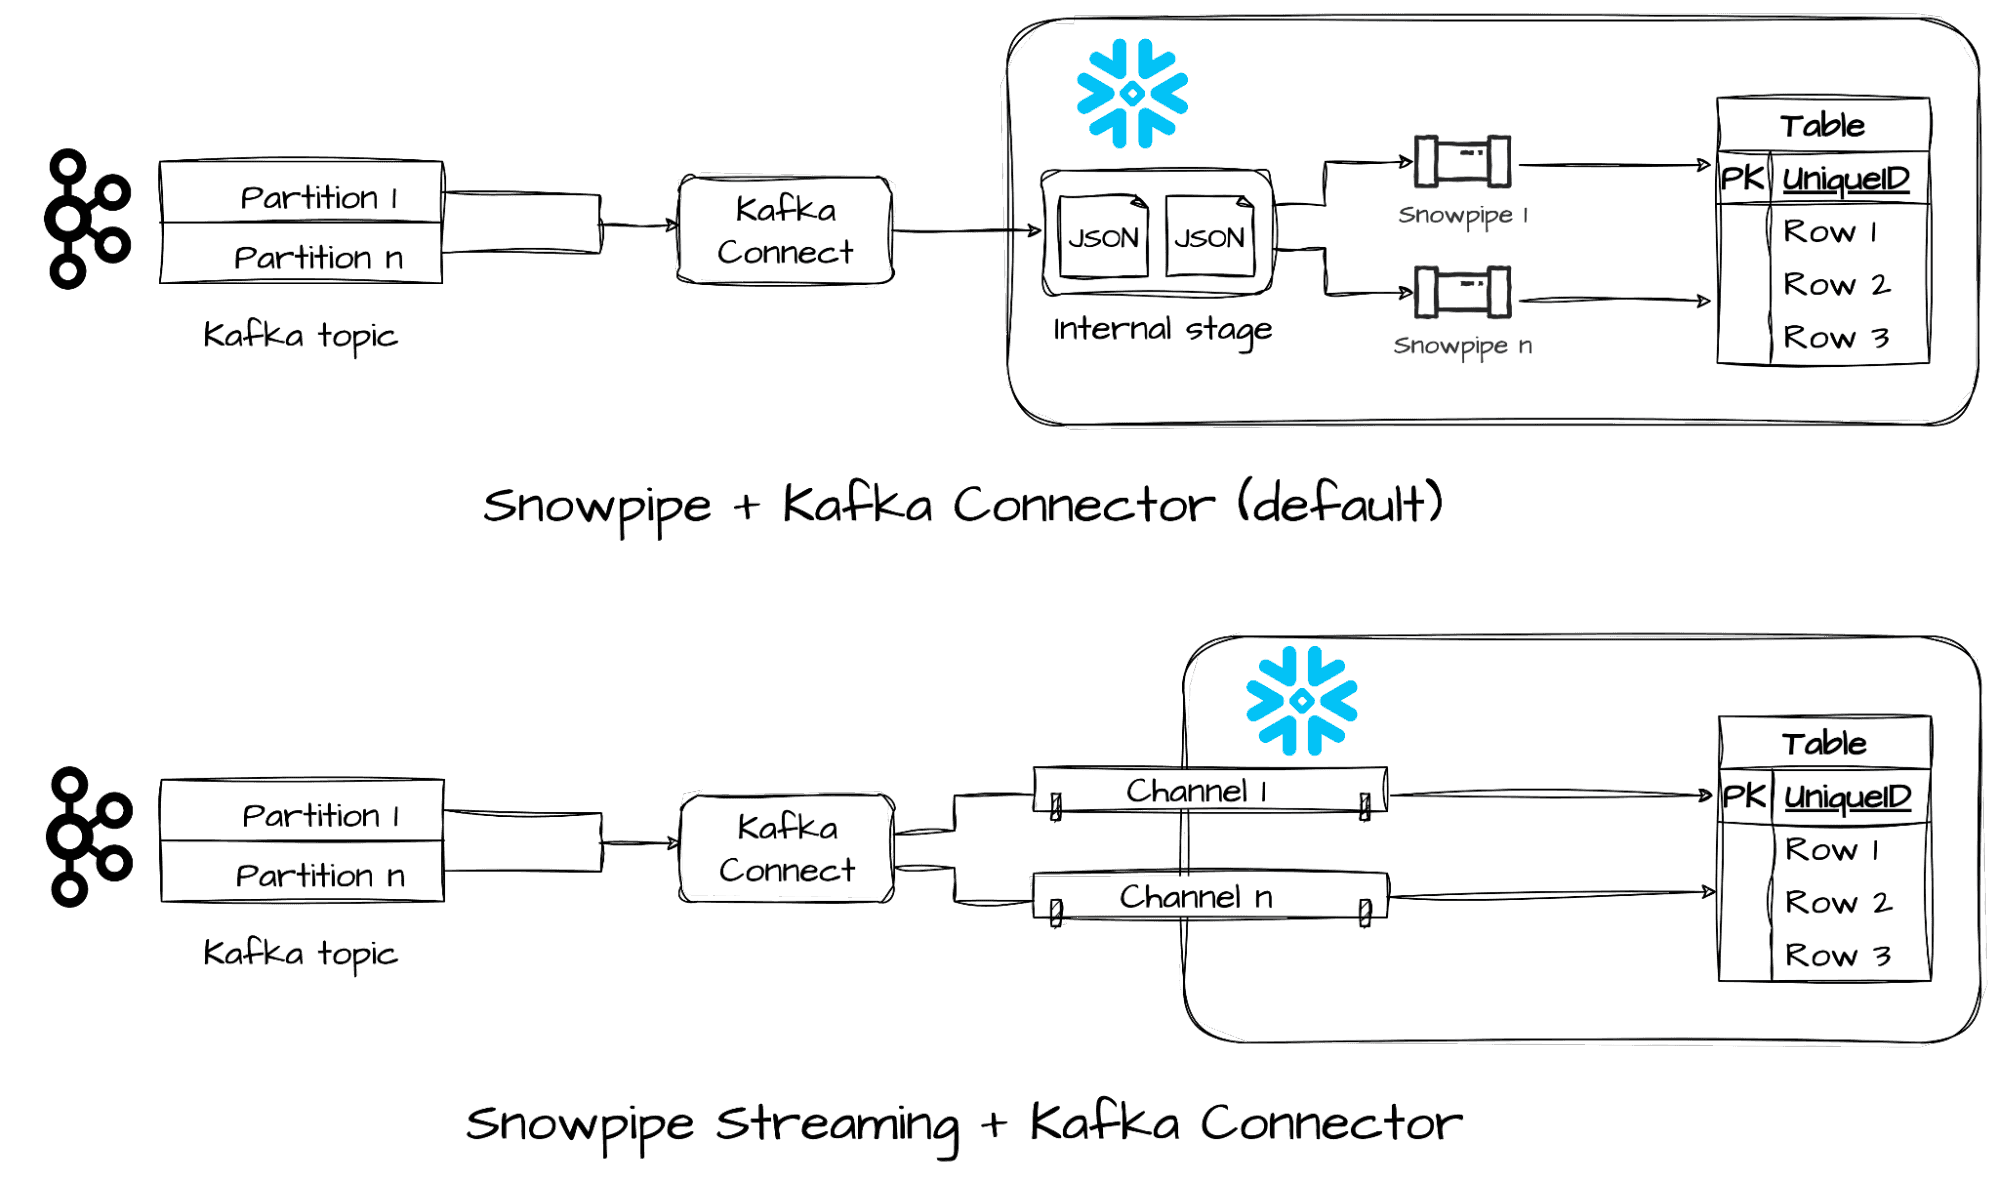
Starting from Kafka Connector (running on top of Kafka Connect) version 2.0.0 it’s possible to specify Snowpipe Streaming as the desired way of data streams ingestion. Unlike the old Snowpipe machinery that relied on internal stages and pipe objects under the hood, the new one allows writing Kafka messages in parallel using separate streaming connections (channels) directly into target tables. Both Avro and JSON data serialization formats are supported with built-in converters.

Source: Using Snowflake Connector for Kafka With Snowpipe Streaming
Continuous data pipelines with Snowflake Dynamic Tables
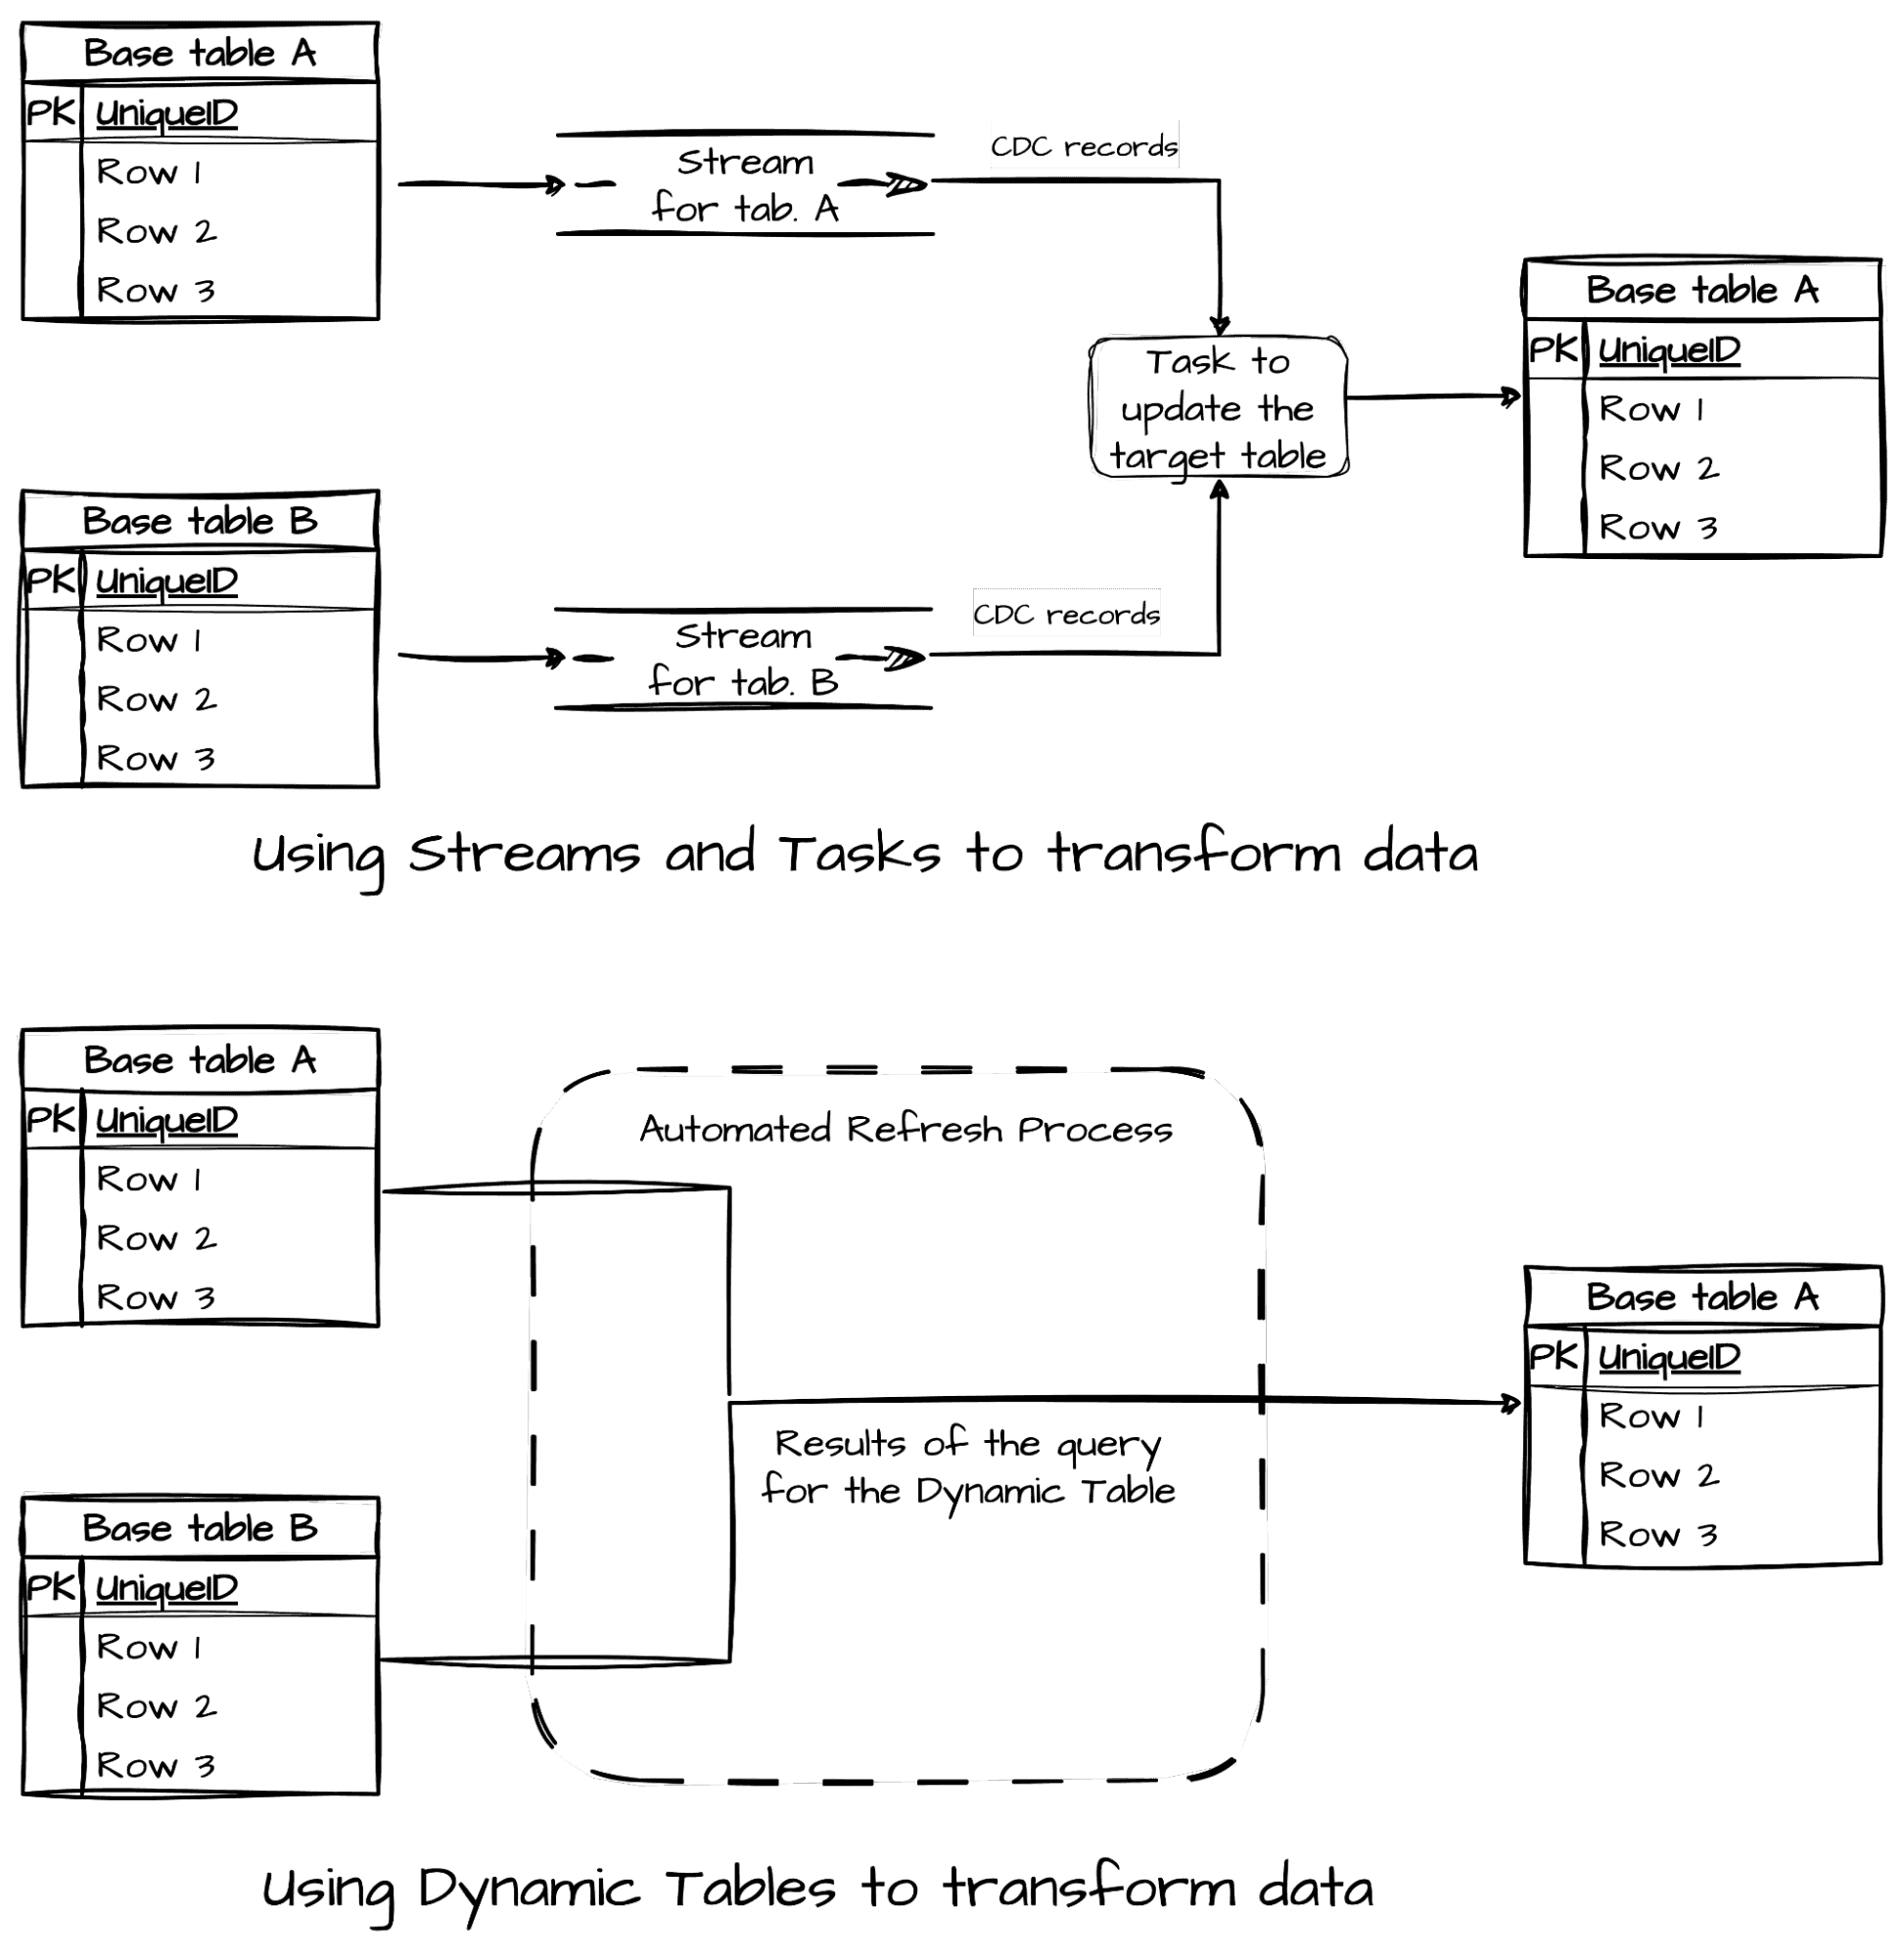
So, we already know that transforming data in batches might not be sufficient enough in our business scenario. Snowflake has been supporting low latency data pipelines for a while now through streams and tasks, however this required you to write and schedule transformations from the base tables yourself.

Source: Dynamic tables compared to streams and tasks and to materialized views | Snowflake Documentation
Snowflake Dynamic Tables use a different, declarative approach - you specify how you’d like to transform (extract, clean, enrich, aggregate, etc.) the data with an SQL query from one or more base tables, and what your desired target level of data freshness (lag) is. This is sufficient to indicate when the tables should be refreshed without involving an external scheduler or orchestrator. Understanding how the refreshes are performed is crucial in getting the most out of the Snowflake’s dynamic tables. What we especially found useful was the option to set the upstream’s dynamic table’s lag to “DOWNSTREAM”, which meant that the upstream dynamic table was refreshed in a “lazy” manner - only if there’s an update request from a downstream dependent dynamic table.
```

CREATE OR REPLACE DYNAMIC TABLE dynamic_orders
 TARGET_LAG = '1 minute'
  WAREHOUSE = LES_WH
  AS
    SELECT
      RECORD_CONTENT:created_at::timestamp as created_at,
      RECORD_CONTENT:delivered_at::timestamp as delivered_at,
      RECORD_CONTENT:gender::string as gender,
      RECORD_CONTENT:num_of_item::integer as num_of_item,
      RECORD_CONTENT:order_id::integer as order_id,
      RECORD_CONTENT:returned_at::timestamp as returned_at,
      RECORD_CONTENT:shipped_at::timestamp as shipped_at,
      RECORD_CONTENT:status::string as status,
      RECORD_CONTENT:user_id::integer as user_id
    FROM
      table_orders

```
A DDL that creates a Snowflake Dynamic Table `dynamic_orders`, which is refreshed from the base (landing) table `table_orders` approximately every minute using `LES_WH` warehouse.
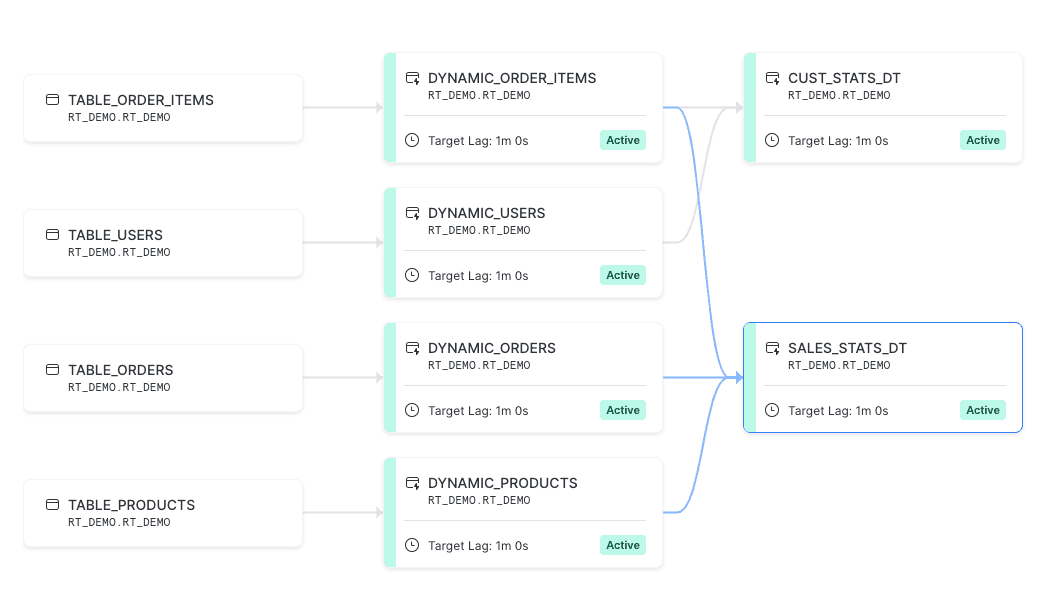
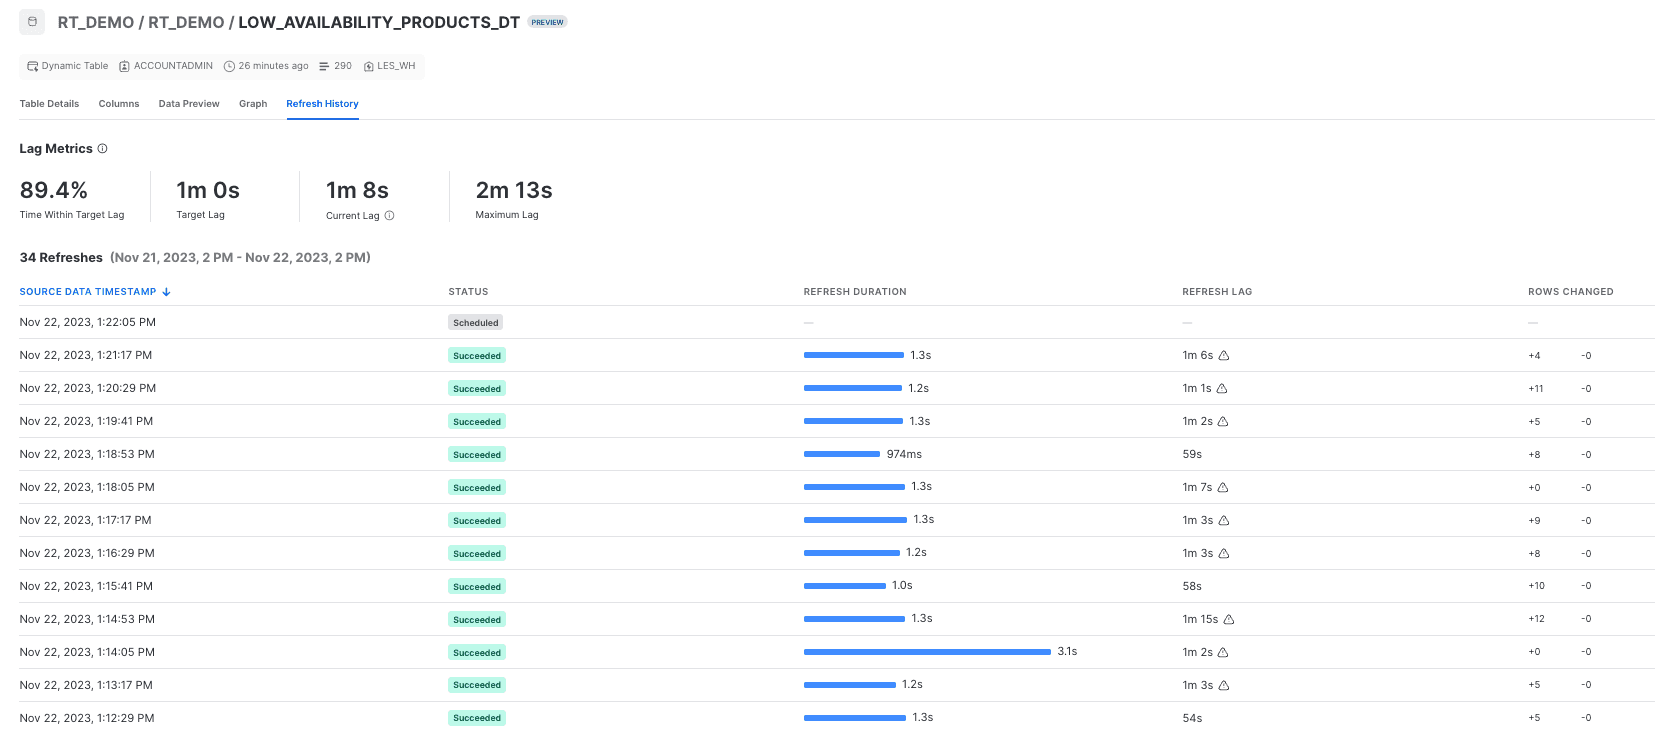
In such a data pipeline you just provide the end state of the transformation in your dynamic table definition and leave the pipeline management to Snowflake. This can be very handy when you don’t want to write code to track data dependencies and manage data refresh yourself, however it also assumes that you don’t need a fine-grained refresh schedule control. At the beginning how this all works might not be too intuitive, however luckily Snowflake collects all the useful dynamic tables related metadata in the ‘information_schema’, which you can easily access through the UI in the ‘Graph’ and ‘Refresh History’ tabs. Here you’ll find out when your dynamic tables got refreshed, how many records got changed, how much time it took and how particular dynamic tables depend on each other.

Graph of dependencies between base and dynamic tables in Snowflake dynamic table’s properties.

Refresh history provides us with detailed information on when dynamic tables got refreshed, how many rows were changed and what the actual lag was.
One of the first questions that arise here is, of course, how much does it cost and what are you charged for? Well, apart from the size of your data, it’s very much connected with how often you’d like to have your dynamic tables get refreshed. The more frequently, the more expensive it gets, which is quite obvious. The cost also depends on how your dynamic tables are defined - whether and when they use full or incremental refresh and your data warehouse type and configuration. Dynamic tables also use cloud services compute to determine whether changes occurred to base objects since the last refresh. If no changes are detected, no virtual warehouse credits are consumed (because there is no data to refresh). More on the costs related to dynamic tables can be found here. In order to get a better intuition for what you’re being charged, we definitely recommend using a separate warehouse for your pipelines with dynamic tables.
Another frequent question is what happens when the base table’s schema changes? In case a new column is added or the change refers to an unused column in dynamic table definition, nothing happens and refreshes are not impacted. In the event when a base table is recreated with the same set of columns, a full refresh is triggered in order to avoid stale or incorrect data in the dynamic table. In all other cases when there is some change to the base table’s structure, the state of the dynamic table turns into `FAILING` which requires its recreation. Details on how this works are described in the Snowflake's documentation.
dbt support for Snowflake Dynamic Tables
dynamic_table as materialization in dbt
Despite the fact that Snowflake Dynamic Tables allow you to define and orchestrate your end-to-end data pipeline (with associated access control configuration and alerts) within one SQL script, engineering best practices tell us that it’s always useful to have your code and configuration supported with a version control, data quality tests and automated docs generation. Luckily, Snowflake Dynamic Tables are supported by dbt’s Snowflake adapter and it’s pretty straightforward to map all the configuration from Snowflake’s DDL statement to dbt model definition.
```
{{ config(
    materialized = 'dynamic_table',
    snowflake_warehouse = 'LES_WH',
    target_lag = '1 minute',
) }}

WITH stream AS (
    SELECT
      RECORD_CONTENT:created_at::timestamp as created_at,
      RECORD_CONTENT:delivered_at::timestamp as delivered_at,
      RECORD_CONTENT:gender::string as gender,
      RECORD_CONTENT:num_of_item::integer as num_of_item,
      RECORD_CONTENT:order_id::integer as order_id,
      RECORD_CONTENT:returned_at::timestamp as returned_at,
      RECORD_CONTENT:shipped_at::timestamp as shipped_at,
      RECORD_CONTENT:status::string as status,
      RECORD_CONTENT:user_id::integer as user_id
    FROM
      {{ source('rt_demo', 'table_orders') }}
SELECT *
FROM
    stream

```
Definition of a dbt model that creates a Snowflake Dynamic Table `dynamic_orders`, which is refreshed from the base (landing) table `table_orders` approximately every minute.
There is a significant difference when it comes to running a dbt model that is materialized as a dynamic table versus a normal table. In the first option you need to launch `dbt run` only once and data will get refreshed according to the configured lag. Everything will be taken care of by Snowflake without the need to use an implicit orchestrator, as in the scenario with normal tables. So the following `dbt run` execution will either be skipped (when no changes are detected) or will trigger a manual refresh (not to be confused with recreation of the table). However, you need to remember that in case of changes to the base tables definition, the model will have to be run in full refresh mode or a recreation of dynamic tables will be required. These scenarios were described above in the section about Snowflake Dynamic Tables.

`dbt run` on dynamic tables is sometimes skipped when no changes in the underlying base tables have been detected.
Continuous data testing with dbt
Moreover, dbt as of version 1.7 has taken a big step towards continuous data quality testing with the option to store test results as a view, table or materialized view. You need to run `dbt test` on top of your dynamic table only once. Let’s suppose you configured `storeB_failure_as: view` - this will create a view definition with your test as an underlying query. Whenever you query the view (for example with a monitoring dashboard), you’ll get all the test failures based on the current state of your dynamic table.
‘’’
      - name: product_id

  description: "Identifier of the product associated with the order item."
        tests:
          - dbt_utils.not_accepted_values:
              name: decommissioned_products
              values: [ '8178']
              config:
                store_failures_as: view
‘’’
A test on product_id, which should be decommissioned and not appear in the orders.
Last but not least, involving dbt allows us to expand our pipeline definition with non-dynamic table related models, which could come in handy in some scenarios.
Real-time analytics with Streamlit in Snowflake
Streamlit is an open-source Python framework that allows you to create web applications for data science and machine learning with minimal effort. What is even more important - data applications powered by Streamlit can be hosted natively in the Snowflake Data Cloud platform. Although its primary use-case is to support exploratory data analysis and serve AI-backed applications, it can be also successfully used (together with Snowpark for Python) for rapid prototyping of dynamic dashboards for near real-time reporting. Before using it you will need to enable Anaconda in your account in order to be able to leverage its packages.

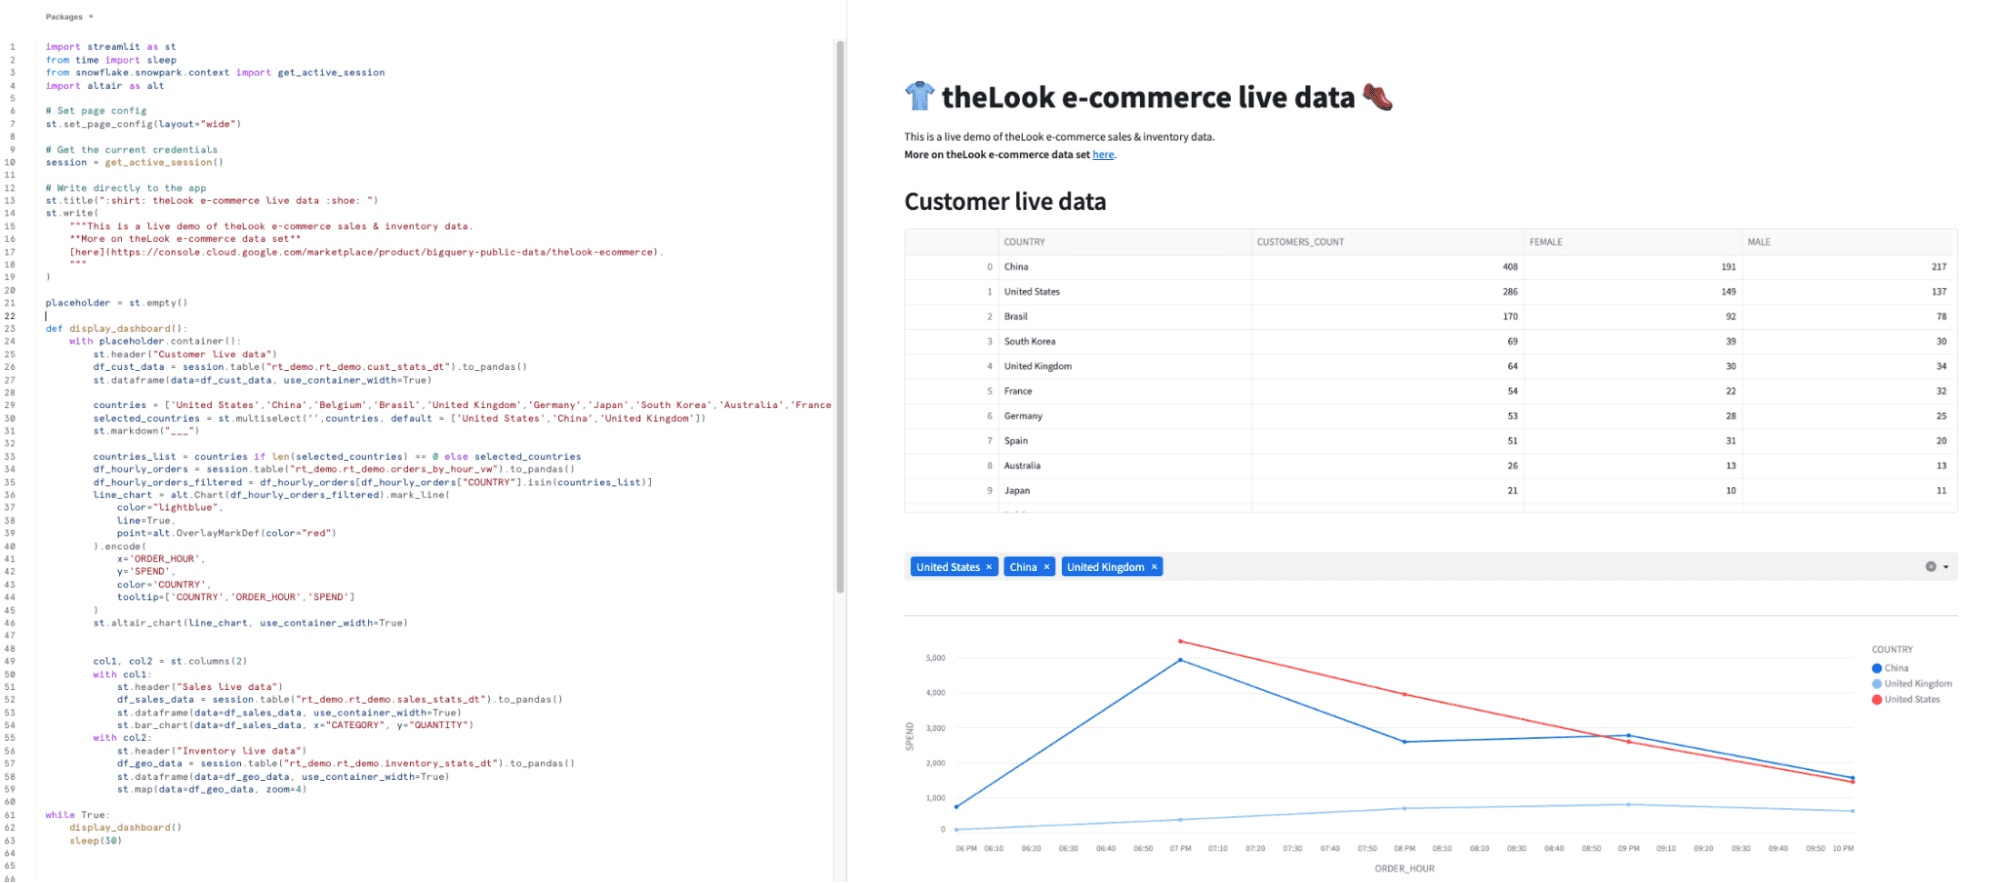
Developing Streamlit application in Snowsight with near real-time analytics on top of theLook e-commerce dataset.
In our business case, we use a Streamlit app to observe how sales and inventory numbers change during the day. Thanks to underlying dynamic tables and easy to configure auto-refresh functionality of the Streamlit dashboard, we have a near real-time business monitoring solution.
Data observability in streaming workloads
We have already mentioned that thanks to the option to materialize dbt test failures as tables or views, we are able to monitor the quality of our data in our streaming pipelines in continuous, near real-time manner. We also know that at any point in time we can find out what’s going on in our Dynamic Tables by querying Snowflake’s metadata or looking at Snowsight’s UI. However, when so many things are going on, this might not be sufficient as in some cases we’d like to be notified right away when something happens in the data. Luckily, apart from Dynamic Tables, Snowflake has also introduced Alerts & Notifications, which will make our streaming pipeline observability complete.
Snowflake Alerts & Notifications
The way it works in general is quite simple and intuitive when it comes to monitoring solutions. When data in Snowflake meets certain conditions at a certain moment in time, a certain action is taken. These conditions could be related to warehouse credit usage, resource consumption of your pipelines or any other business condition that can be defined in an SQL statement. You can also specify how often this condition is evaluated (e.g. once an hour, every Sunday at midnight, etc.) and what should be done if the alerting condition is met - for example an insert to a logging table or sending an email notification.
One example of when we’d like to be instantly notified is whenever an inventory of a certain product drops below a certain threshold. Let’s imagine that on Black Friday we have a high demand for Christmas sweaters and we don’t want to disappoint our customers by letting them know that the product is out of stock. We’d like to be informed in advance as soon as we notice there are just a couple of them left.
First, let’s create a dynamic table that will inform us which products are low in the inventory every five minutes (let’s say - one item left).
```
{{ config(
    materialized = 'dynamic_table',
    snowflake_warehouse = 'LES_WH',
    target_lag = '5 minute',
) }}


-- List items with low availability
WITH low_availability_products AS (
    SELECT product_id, COUNT(*) AS items_left
    FROM {{ ref('dynamic_inventory_items')}} ii
    WHERE sold_at IS NULL
    GROUP BY 1
    HAVING COUNT(*) < 2
)
SELECT oi.inventory_item_id, oi.product_id, p.brand, p.category, p.department, p.name, lap.items_left
FROM {{ ref('dynamic_order_items')}} oi
JOIN low_availability_products lap
ON oi.product_id = lap.product_id
LEFT JOIN {{ ref('dynamic_products')}} p
ON oi.product_id = p.id
WHERE oi.status NOT IN ('Returned','Cancelled')
ORDER BY product_id, inventory_item_id
```
Then on top of that we can configure an alert that would check every, let’s say, 15 minutes if something else in the inventory requires immediate action.
```
-- Creating email integration & allowed recipients
DROP INTEGRATION IF EXISTS my_email_int;
CREATE NOTIFICATION INTEGRATION my_email_int
  TYPE=EMAIL
  ENABLED=TRUE
  ALLOWED_RECIPIENTS=('inventory_monitoring@example.com');

-- Create an alert to notify the Inventory Team when an order appeared on a low inventory item from a category “Sweaters”
CREATE OR REPLACE ALERT alert_low_availability_product_order
  WAREHOUSE = LES_WH
  SCHEDULE = '15 MINUTES'
  IF (EXISTS (
      SELECT *
      FROM low_availability_products_dt
      WHERE category = 'Sweaters'
  ))
  THEN CALL SYSTEM$SEND_EMAIL(
    'my_email_int',
    'inventory_monitoring@example.com',
    'Email Alert: Order placed on a low availability product.',
    'All the sweaters will soon be gone. Let’s do something!'
);

-- Activating alert upon creation
ALTER ALERT alert_low_availability_product_order RESUME;
```
Snowflake Alerts can also be configured to check whether something happened between the last successful and current schedule time. Let’s take for example our condition that verifies if there is an order for a product that was supposed to be decommissioned. The alert will only be triggered when there is a new observation from the time it was last executed successfully.
```

-- Create an alert to notify the Inventory Team when a decommissioned product appears in the orders
CREATE OR REPLACE ALERT alert_decommissioned_products
  WAREHOUSE = LES_WH
  SCHEDULE = '1 MINUTE'
  IF (EXISTS (
      SELECT *
      FROM decommissioned_products
      WHERE row_timestamp BETWEEN SNOWFLAKE.ALERT.LAST_SUCCESSFUL_SCHEDULED_TIME()
       AND SNOWFLAKE.ALERT.SCHEDULED_TIME()
  ))
  THEN CALL SYSTEM$SEND_EMAIL(
    'my_email_int',
    'inventory_monitoring@example.com',
    'Email Alert: Detected a decommissioned product in orders.',
    'Please check the orders table.'
);

-- Activating alert upon creation
ALTER ALERT alert_decommissioned_products RESUME;
```
Apart from managing (suspending, resuming), Snowflake also allows the monitoring of the execution of alerts in the alert history, which is another great feature when you’d like to have everything under your control.
Bleeding edge means limitations
As mentioned in the first paragraphs, we’ve been going through mostly new solutions, that although are very exciting at the first glance, need to be battle tested in the real world. This applies to both particular solutions themselves as well as how they could be integrated with each other. For example, best practices on how to combine dbt with Snowflake Dynamic Tables are still being developed. Having created this initial setup, we’re all excited to see where it’s gonna go from here!
When considering the backbone of our stack - Snowflake Dynamic Tables, although they support most of the useful SQL statements, there are a couple of limitations as to what you can use in your dynamic table’s definition. For example, all non-deterministic objects are ruled out (context functions, views, etc). We also need to take into account the minimum refresh interval (currently 1 minute), which might be problematic for use cases requiring very low latency. More about these limitations can be found in the documentation.
When it comes to data visualization, there is also a list of items currently not supported by Streamlit (no custom components, lack of integration with popular CI/CD solutions, a limited list of Python libraries you can use, etc). It’s also worth knowing that the Streamlit version on Snowflake might be a bit lower than the most current version in Streamlit. Nevertheless, when this integration becomes GA, we’re pretty sure that the list of limitations will get shorter.
Last but not least, one thing that is always worth remembering when deciding on low latency pipelines - the more often you refresh your data, the more credits will be consumed. It’s of course non-linear, however it’s a good rule of thumb to know how often you refresh both your dashboard and dynamic table. So make sure you understand how frequently your business cases require refreshing. Luckily, in both cases we can easily configure and adjust how fresh our data insights should be. Moreover, Snowflake provides some out-of-the-box cost optimization techniques (like auto-suspension of data warehouses after some time of inactivity and resource monitors), which definitely allow a fine grained budget control.
Use cases & summary
All right, we’ve gone through a lot of cool new technologies, but at the end of the day it’s the business value that matters. So, to put it simply - where do we save time or money (or both) here and which use cases is this new stack likely to support well? Well, from a business perspective, there are no specific limitations so you can easily introduce this stack to the supply chain (inventory and order management), invoice management, website analytics or any other business intelligence workflow.
What we found most impressive is how this managed (yet leveraging open source projects), incremental by nature, low-ops solution could cut the costs and complexity of building end-to-end scalable (from daily, hourly batch to near real-time) data pipelines. Going into low latency solutions does not mean doing everything from scratch and introducing a new data processing stack - although we might get rid of complex dbt incremental models, we can still leverage dbt to incorporate good engineering practices (CI/CD, continuous data testing, automated documentation) and data project standardization.
Streamlit in Snowflake on the other hand, allows rapid data apps development and serving without having to move data anywhere outside from Snowflake taking advantage of the robust Snowflake security features. Last but not least, thanks to Snowflake Alerts & Notifications we can get notified when a critical business situation occurs. All this looks very promising, doesn’t it?
If you’re interested in how we put all the pieces together end-to-end, stay tuned for the demo that we’ll be publishing shortly. Meanwhile, we can boldly exclaim - bring it on, Black Friday, Father’s Day, Easter, or any other e-commerce event, we’re ready!
If you need assistance in getting deeper into near real-time solutions, you can sign up for free consultations with our experts.

