Transformative Data Solutions: 3 Inspiring Success Stories You Need to Know
Businesses across industries are using advanced data analytics and machine learning to revolutionize how they operate. From detecting anomalies to…
Read moreAt GetInData, we understand the value of full observability across our application stacks.
For our Customers, we always recommend solutions able to provide such visibility.
Stay with me throughout this post; you will see why it is so popular, important, and desired.
Full observability brings many benefits to your application stacks:
More than half of GetInData's currently active projects are those where we manage observability stacks completely, which means we design, implement and maintain monitoring, logging, and tracing of our application stacks:
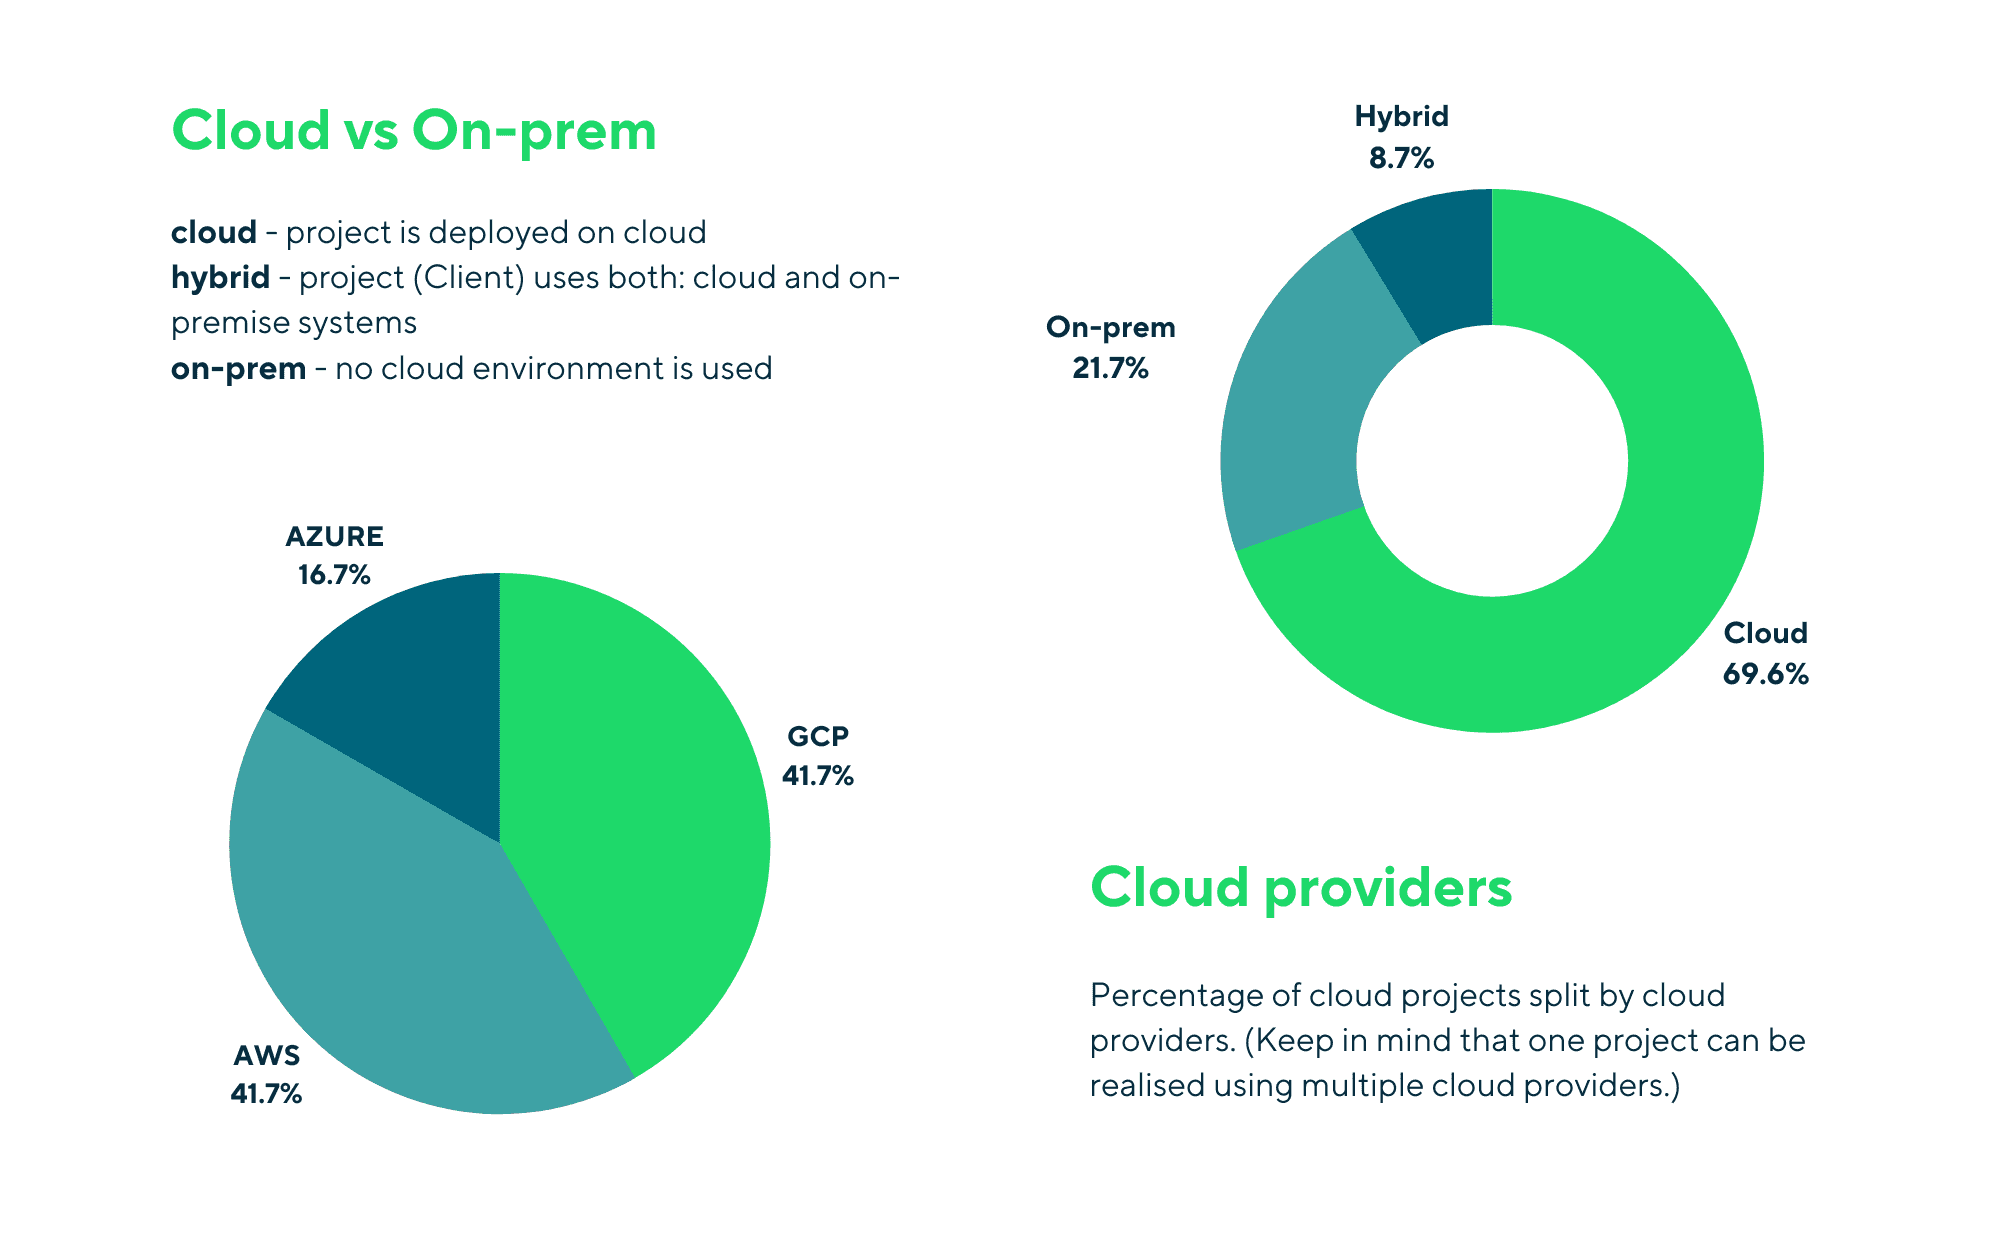
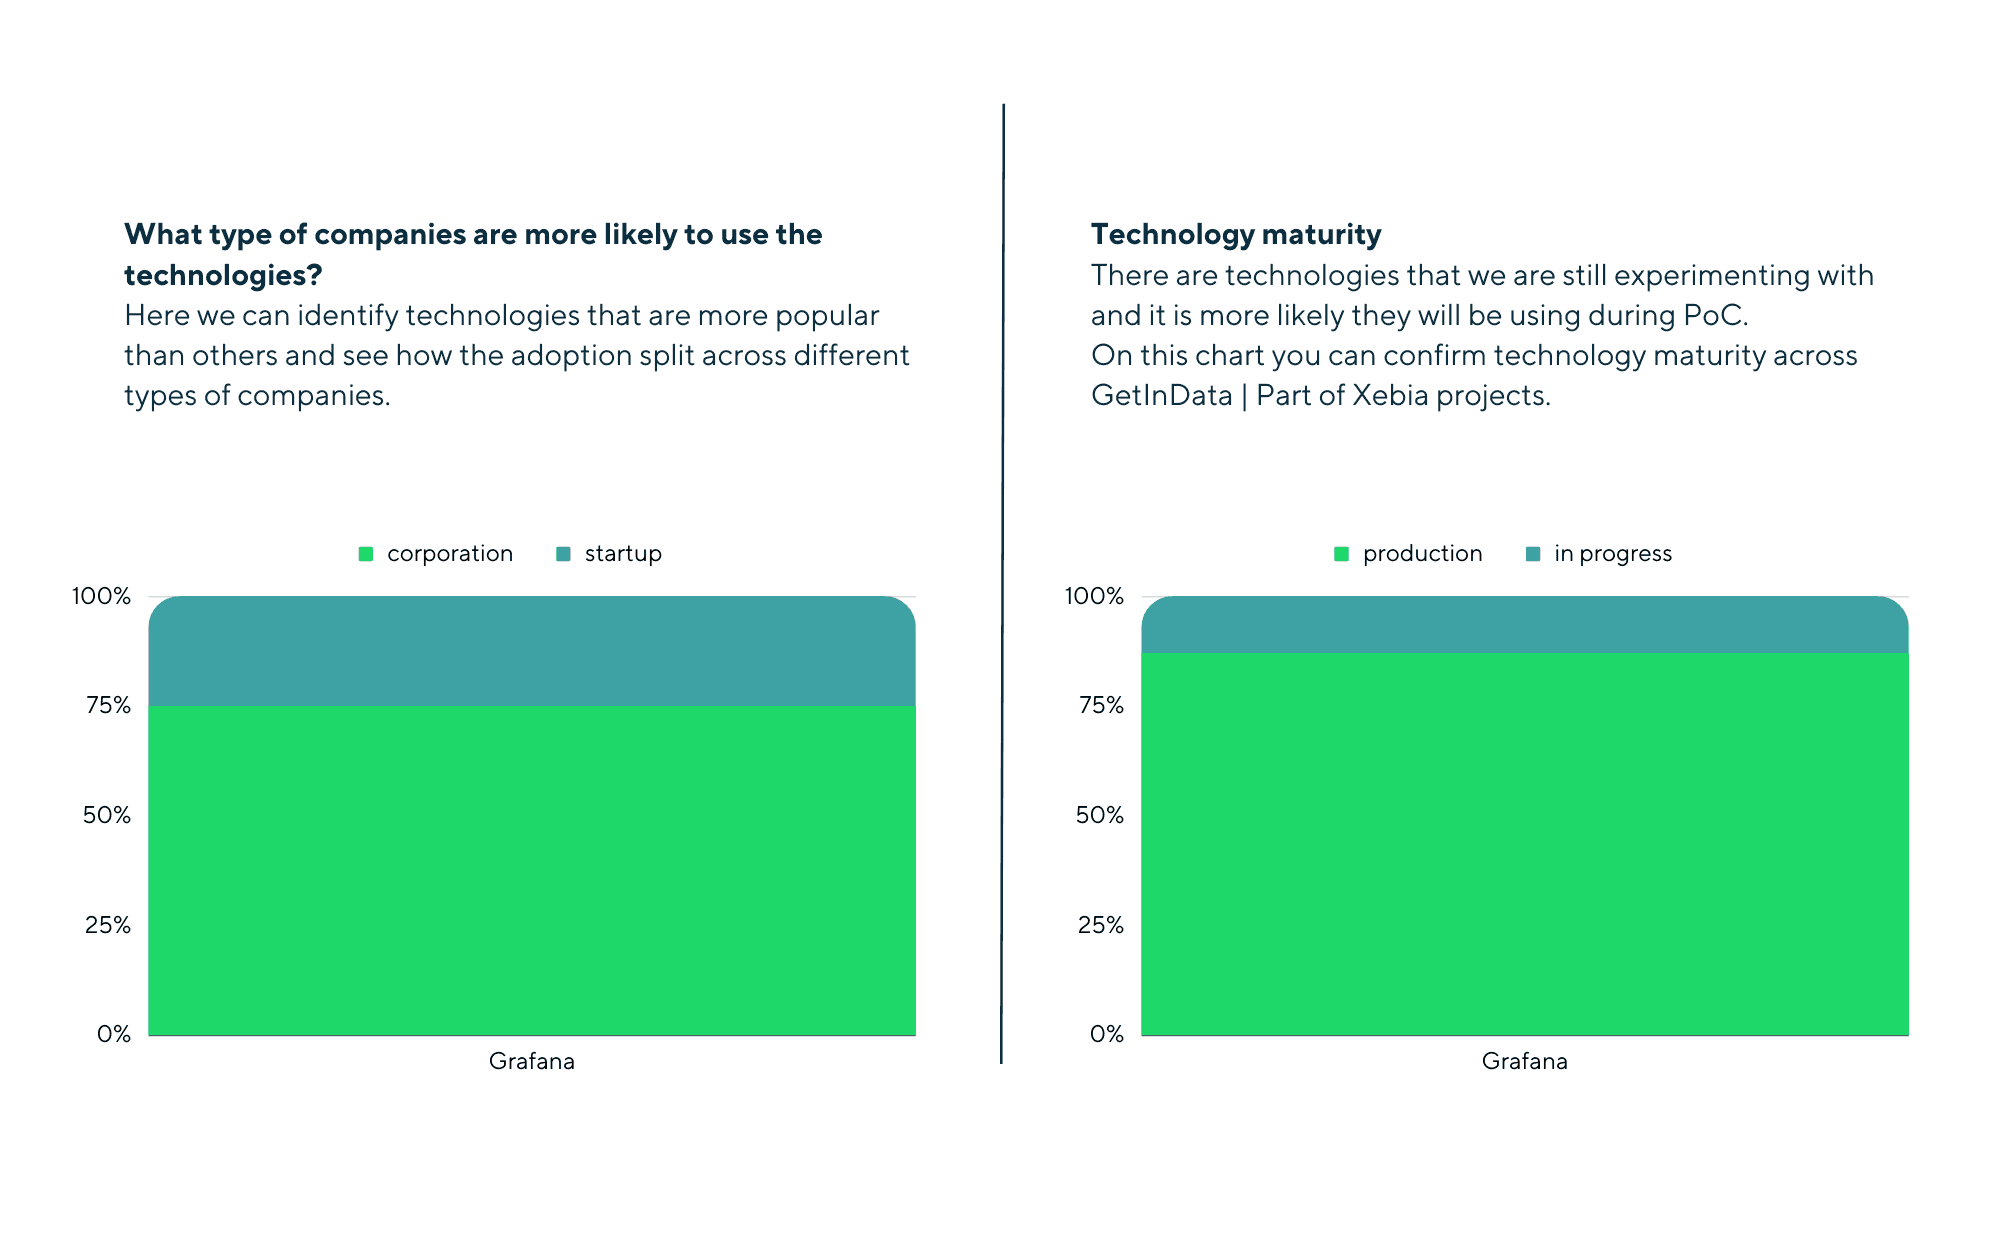
To be able to reuse our stack in multiple project scenarios, it needs to be flexible.
Generally, our requirements for the stack are:
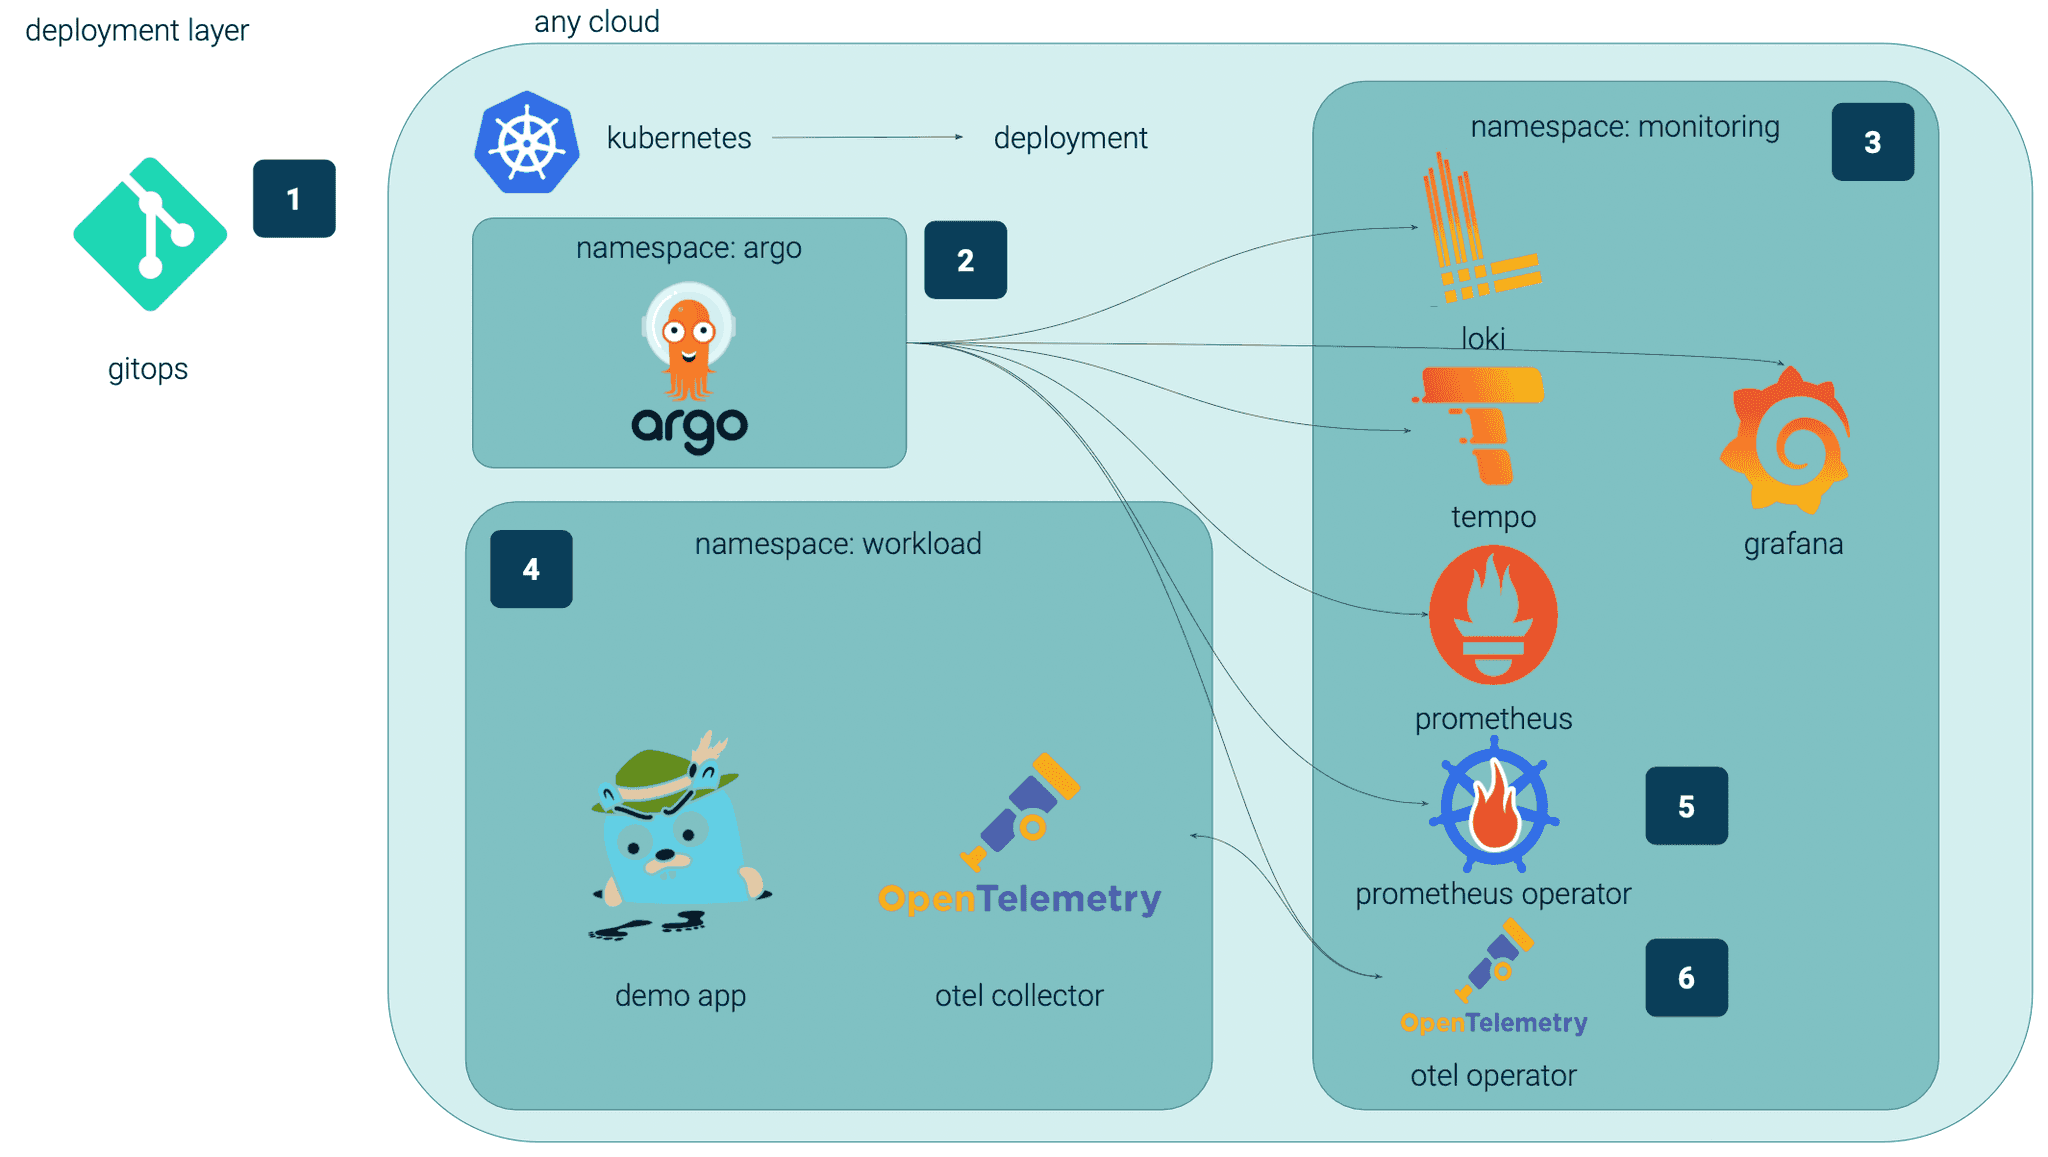
The ability to deploy our stack across multiple cloud providers comes with Kubernetes (K8s).
The idea is simple: deploy the stack on top of any cloud-based Kubernetes. That’s it!
Plenty of tools are out there, but as always, some are better than others.
Those that we use provide the best functionality currently available.
Having your results is one thing, but waiting for them can definitely ruin all the fun.
This is why we rely on modern tools that are able to provide the best performance.


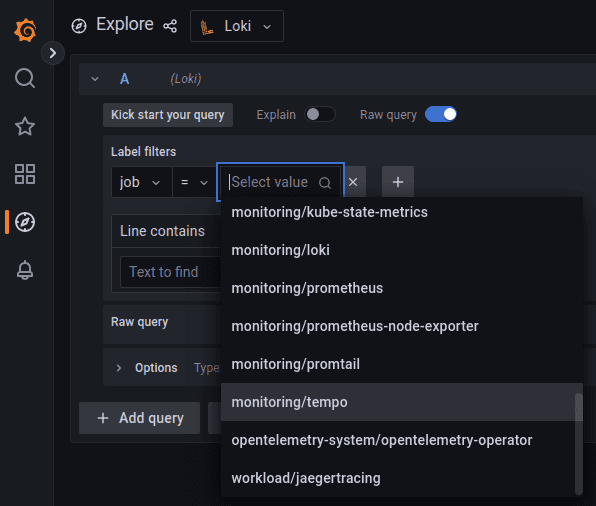
Loki provides centralized logging already integrated with Tempo, available via Grafana:
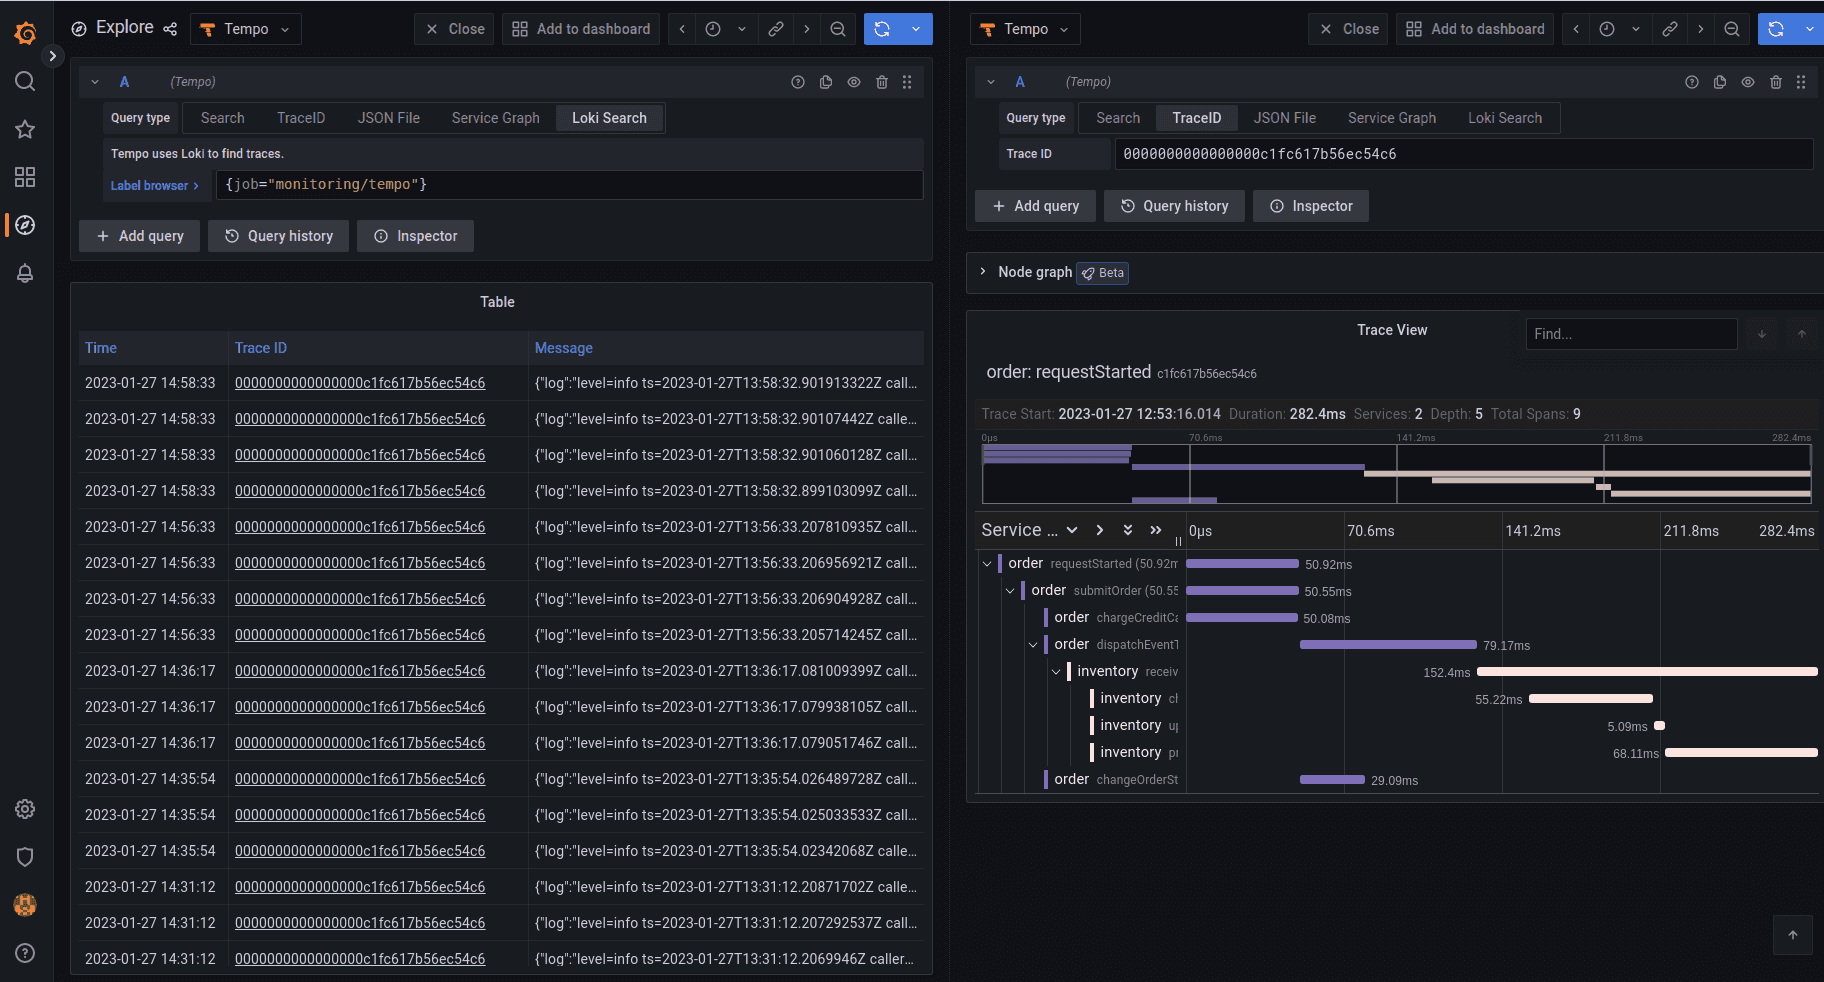
You can search traces in logs and view them in tempo at the same time:
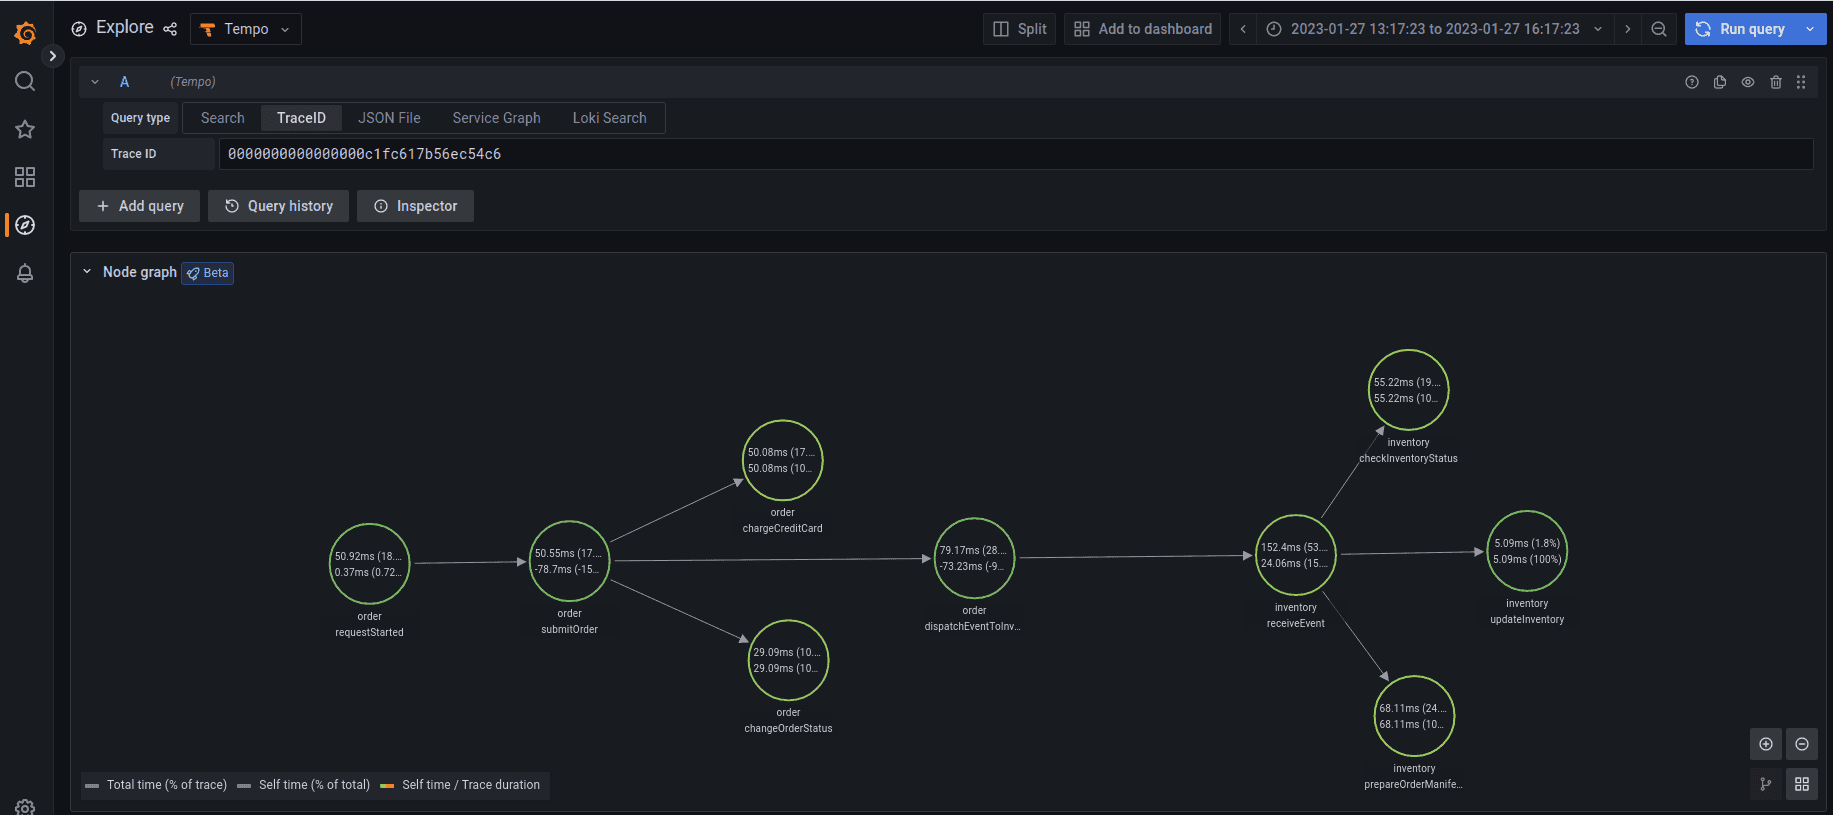
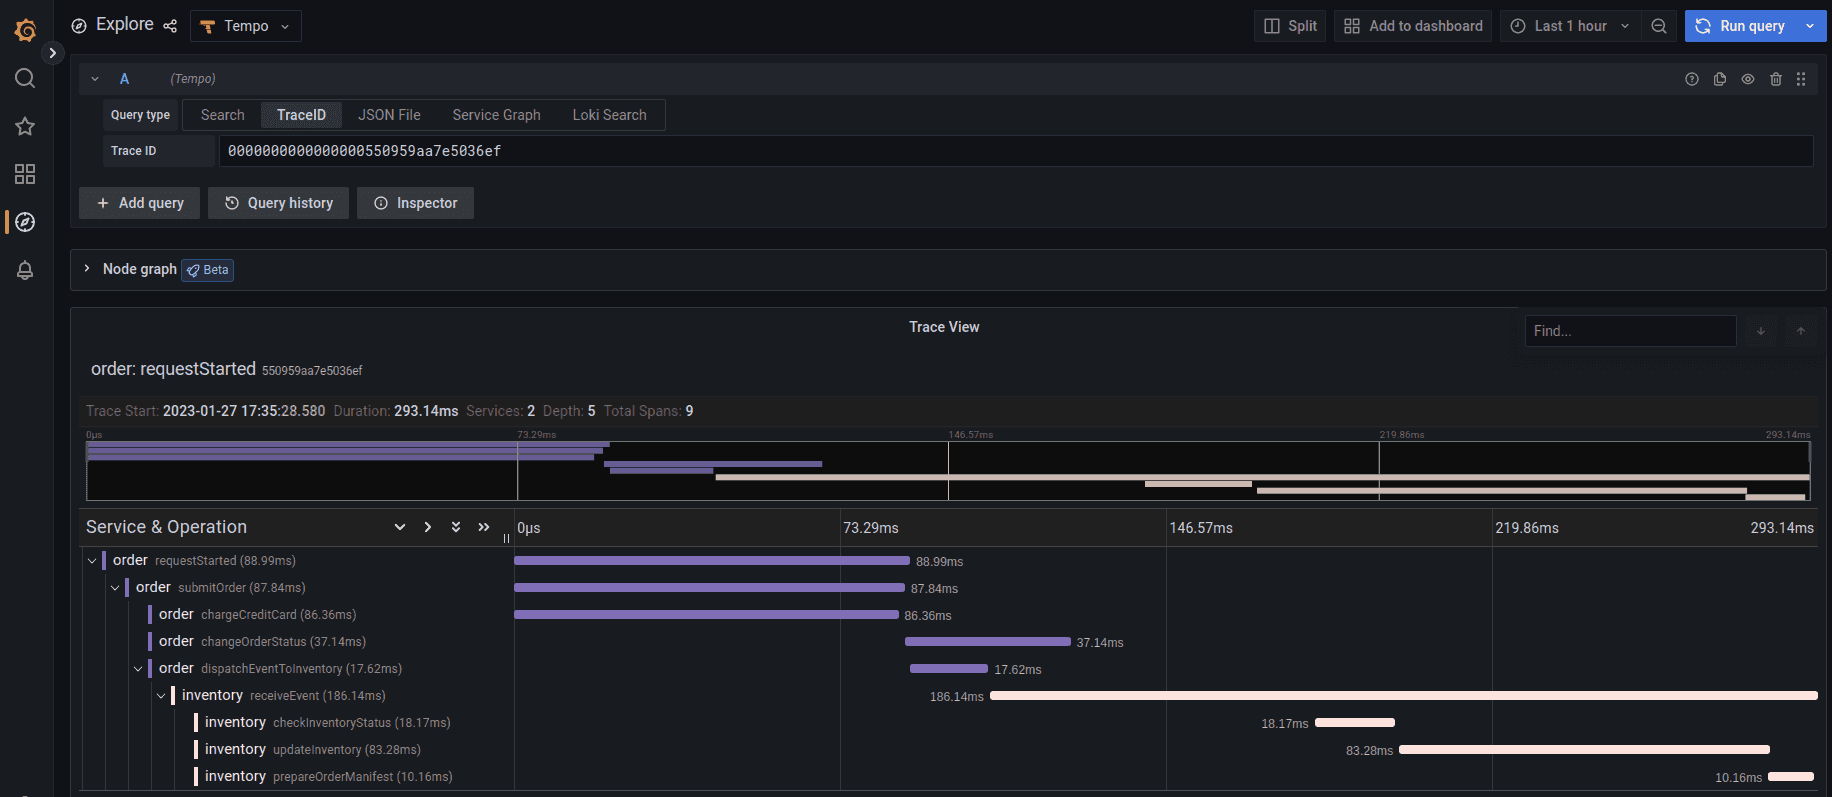
Once you find your trace, the node graph shows the graphical representation of its flow:
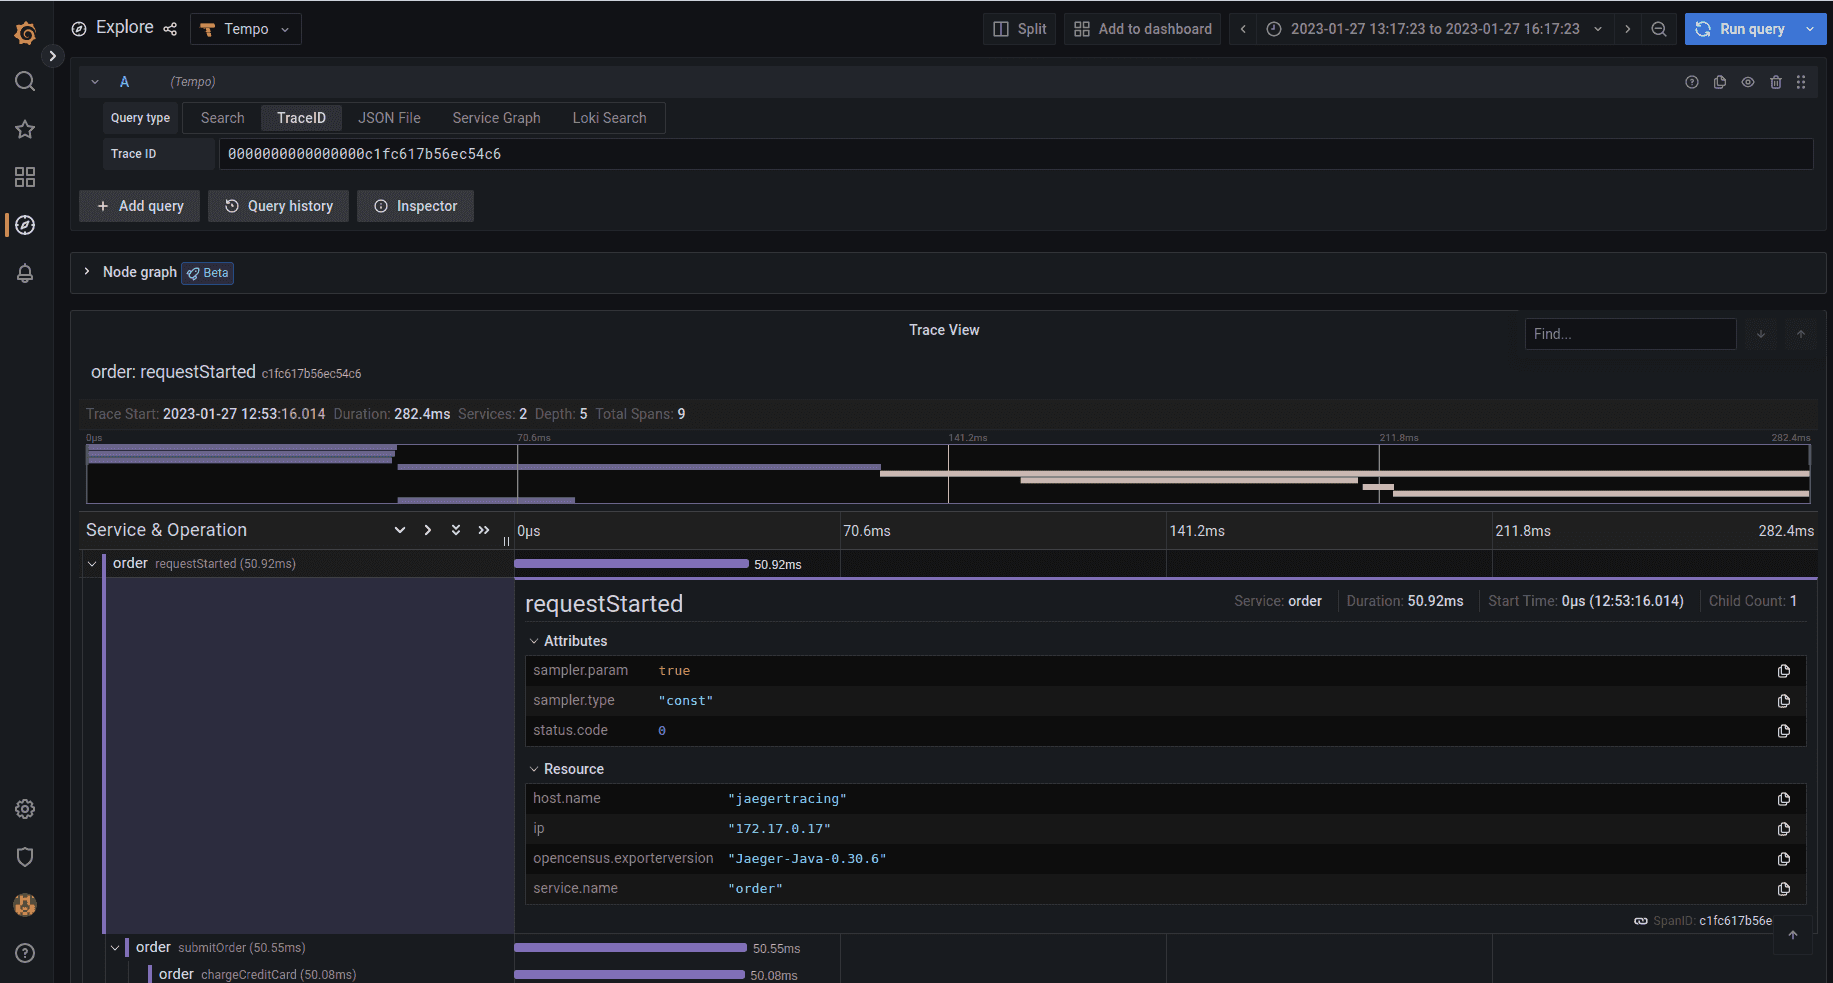
Tempo provides all details on all stages of the trace:
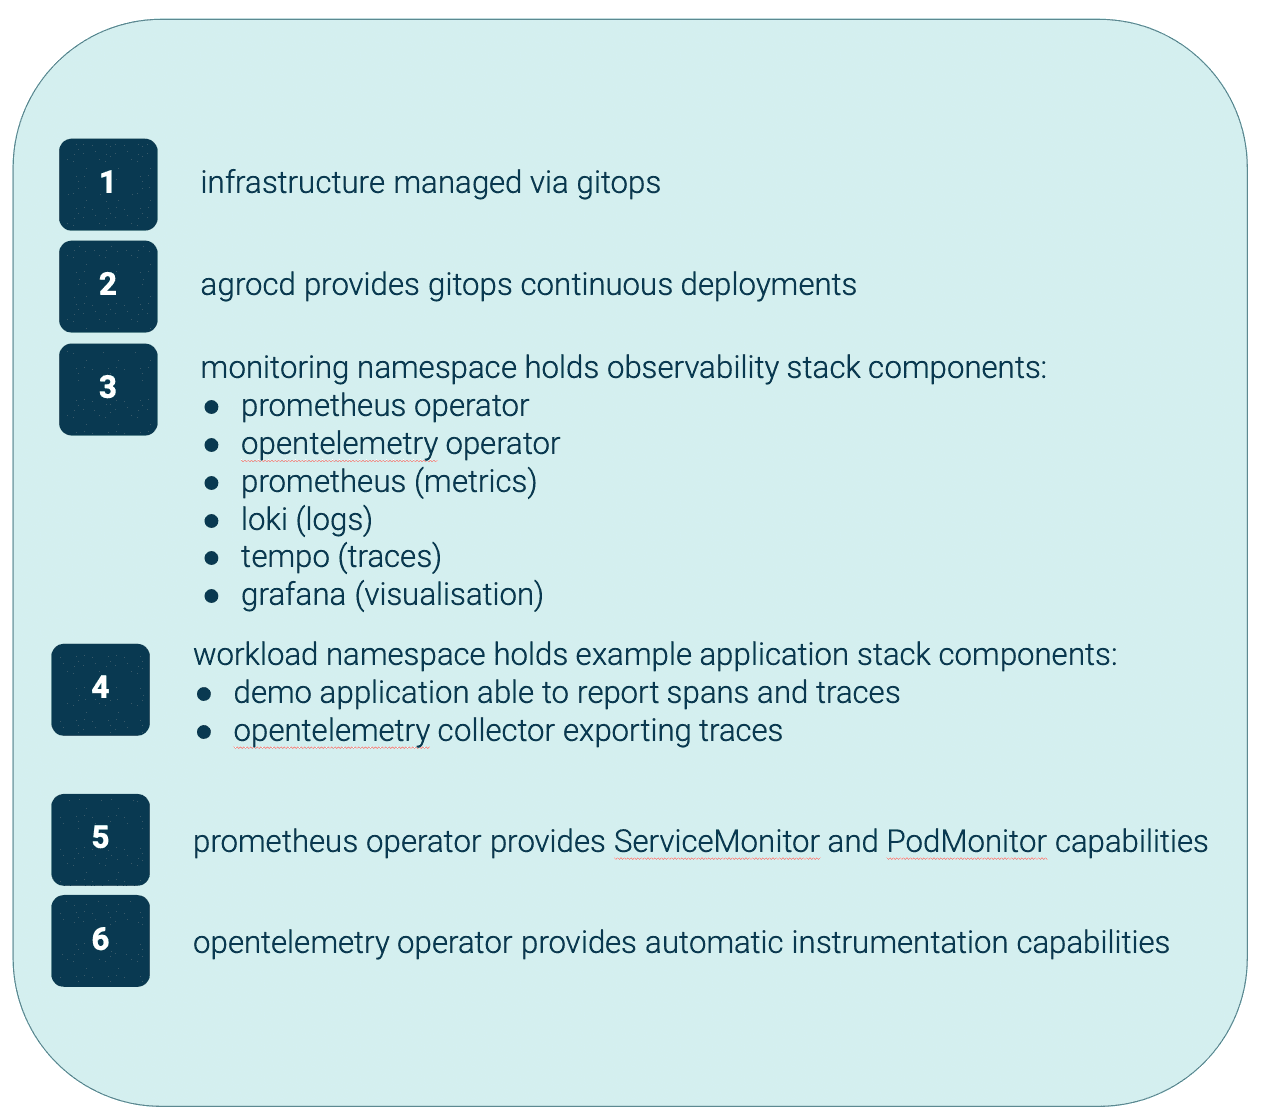
Prometheus operator provides ServiceMonitor and PodMonitor capabilities.
It automatically configures metrics endpoints for your applications:
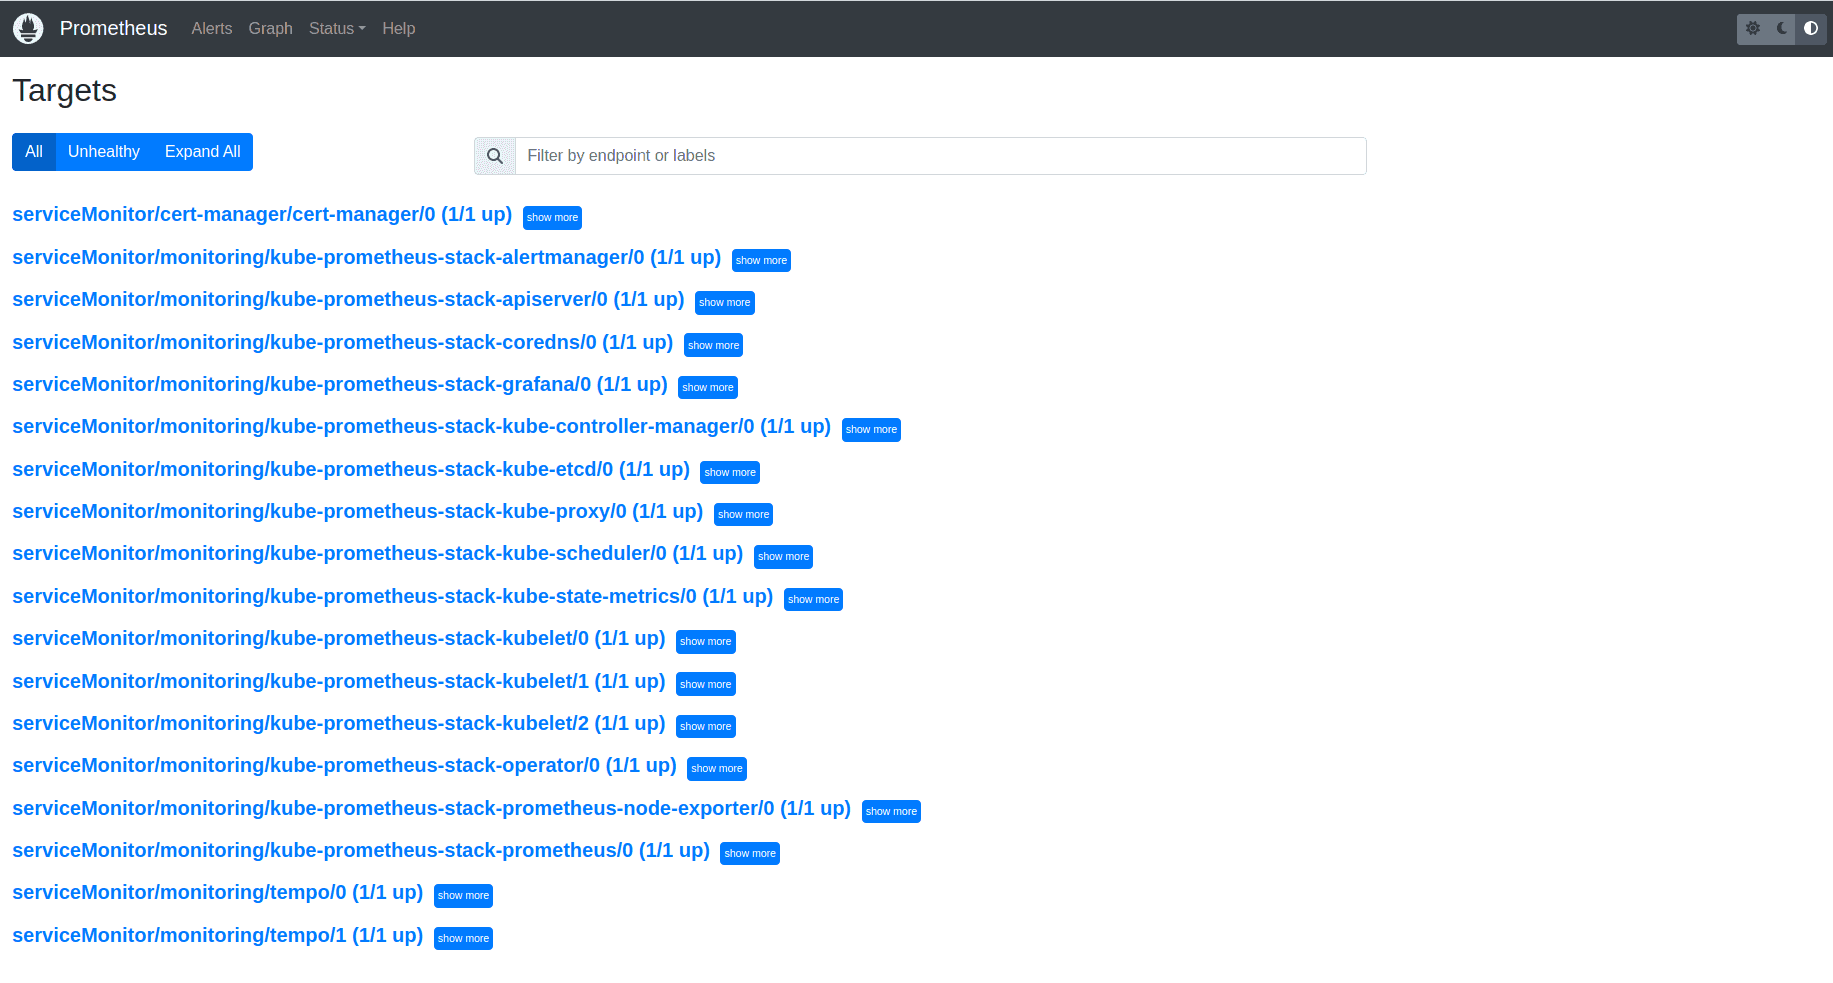
You can then focus on your dashboards and metrics instead of configuring them:
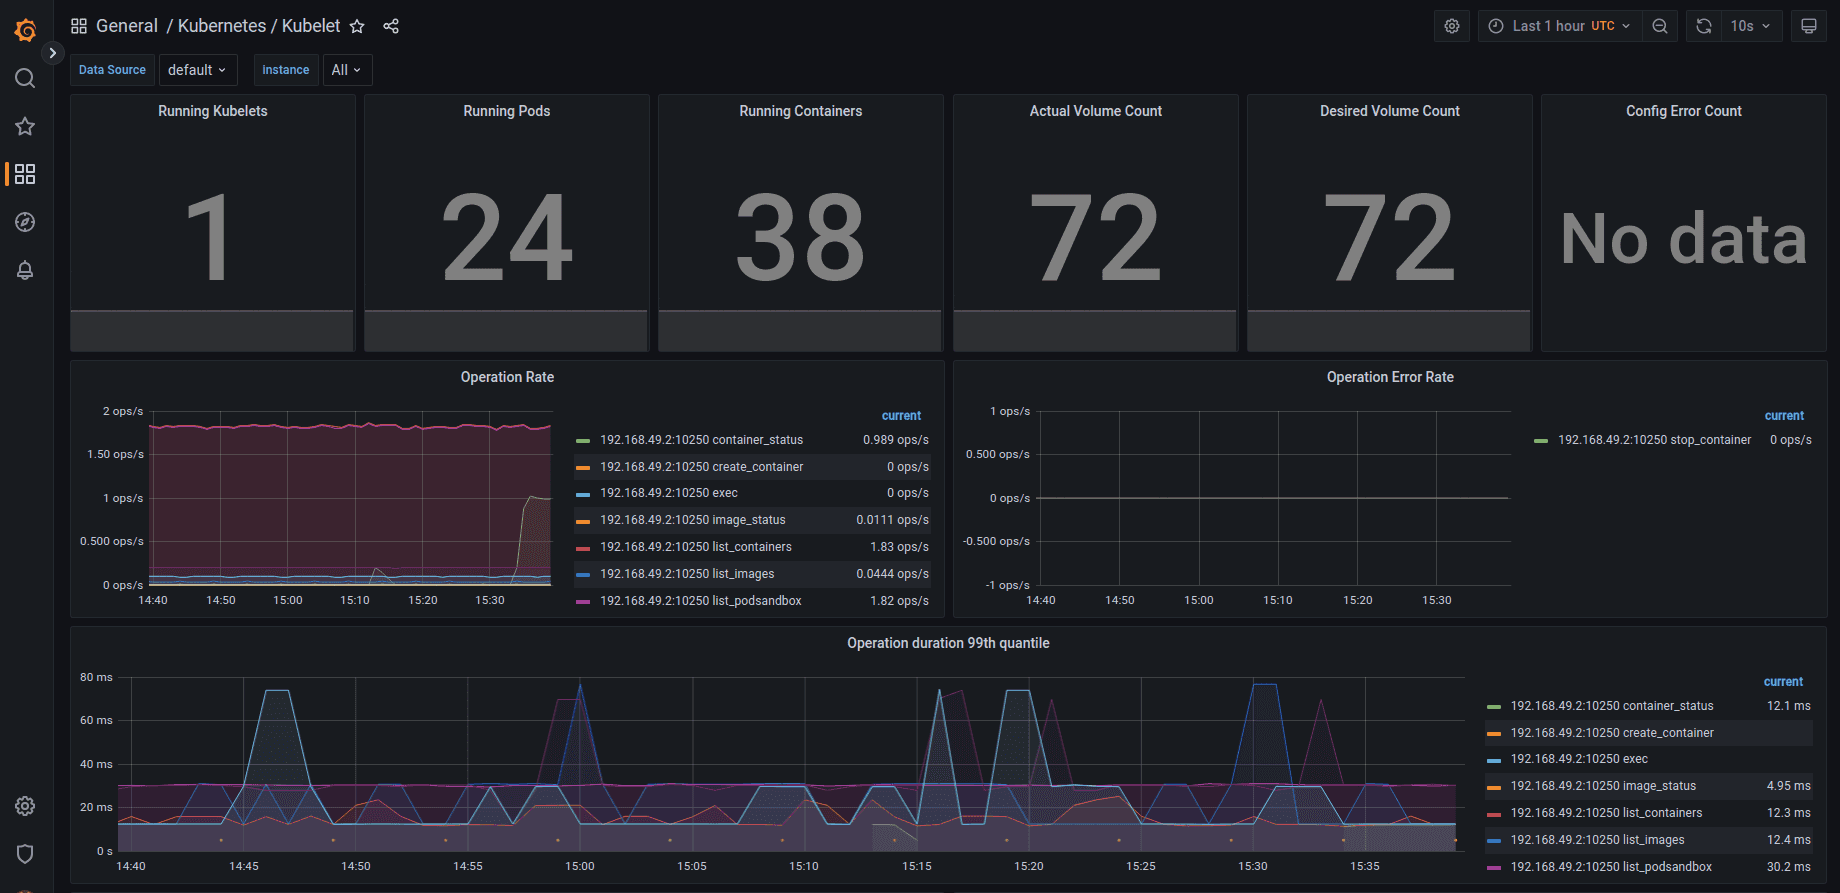
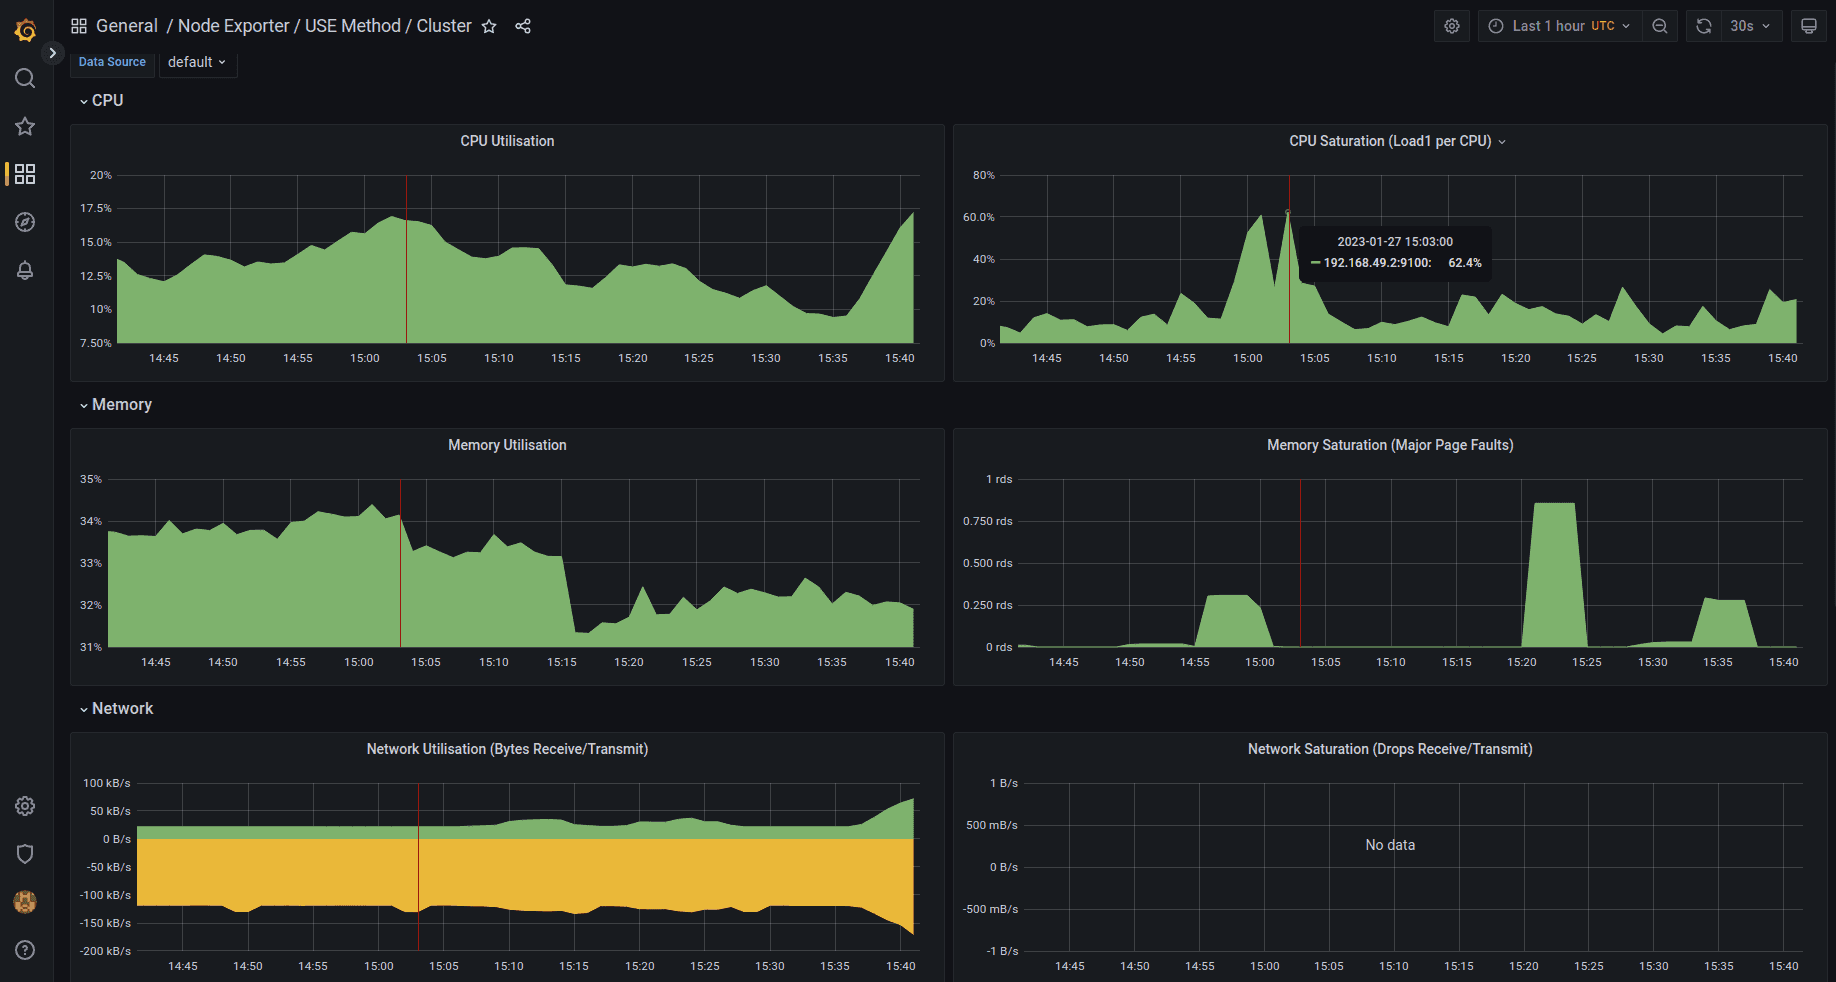
The OpenTelemetry operator provides automatic instrumentation for your applications.
For .Net, Java, NodeJS and Python you can get metrics, logs and traces without changing your application code.
Operator injects related collector configuration as a side container to your pods serving your workloads.
As shown in the Architecture diagrams, the collector can receive traces, metrics and logs and export them to our monitoring stack components.
In our case we configured the collector to receive traces from the jaegertracing pod and export them via the OTLP protocol towards tempo instance:
apiVersion: opentelemetry.io/v1alpha1
kind: OpenTelemetryCollector
metadata:
  name: sidecar-jaeger2tempo
spec:
  mode: sidecar
  config: |
    receivers:
      jaeger:
        protocols:
          thrift_compact:
    processors:
      batch:
    exporters:
      logging:
        loglevel: debug
      otlphttp:
        endpoint: http://tempo.monitoring.svc.cluster.local:4318
    service:
      pipelines:
        traces:
          receivers: [jaeger]
          processors: [batch]
          exporters: [logging, otlphttp]
Then all we need to do is to annotate our application pod in a proper way:
apiVersion: v1
kind: Pod
metadata:
  name: jaegertracing
  annotations:
    sidecar.opentelemetry.io/inject: "true"
spec:
  containers:
  - name: myapp
    image: jaegertracing/vertx-create-span:operator-e2e-tests
    env:
    ports:
      - containerPort: 8080
        protocol: TCP
Once deployed, we can confirm in the OpenTelemetry operator logs the creation of the collector:
{"level":"info","ts":1674809899.2073207,"msg":"Starting workers","controller":"opentelemetrycollector","controllerGroup":"opentelemetry.io","controllerKind":"OpenTelemetryCollector","worker count":1}
{"level":"info","ts":1674812036.5120418,"logger":"opentelemetrycollector-resource","msg":"default","name":"sidecar-jaeger2tempo"}
{"level":"info","ts":1674812036.5131807,"logger":"opentelemetrycollector-resource","msg":"validate create","name":"sidecar-jaeger2tempo"}
{"level":"info","ts":1674812190.6536167,"msg":"truncating container port name","port.name.prev":"jaeger-thrift-compact","port.name.new":"jaeger-thrift-c"}
Our pod now has an additional container - otc-container handling OpenTelemetry functionalities:
Name:         jaegertracing
Namespace:    workload
{output omitted}
Labels: sidecar.opentelemetry.io/injected=workload.sidecar-jaeger2tempo
Annotations:  sidecar.opentelemetry.io/inject: true
{output omitted}
Containers:
  myapp:
{output omitted}
  otc-container:
{output omitted}
    Environment:
      POD_NAME:                            jaegertracing (v1:metadata.name)
      OTEL_RESOURCE_ATTRIBUTES_POD_NAME:   jaegertracing (v1:metadata.name)
      OTEL_RESOURCE_ATTRIBUTES_POD_UID:     (v1:metadata.uid)
      OTEL_RESOURCE_ATTRIBUTES_NODE_NAME:   (v1:spec.nodeName)
      OTEL_RESOURCE_ATTRIBUTES:            k8s.namespace.name=workload,k8s.node.name=$(OTEL_RESOURCE_ATTRIBUTES_NODE_NAME),k8s.pod.name=$(OTEL_RESOURCE_ATTRIBUTES_POD_NAME),k8s.pod.uid=$(OTEL_RESOURCE_ATTRIBUTES_POD_UID)
Let’s trigger some spans and traces via port forwarded jaegertracing pod:
curl localhost:8080
Hello from Vert.x!

kubectl logs -n workload jaegertracing otc-container --tail 31
Span #1
    Trace ID       : 0000000000000000550959aa7e5036ef
    Parent ID      : 419eda90943e0c03
    ID             : 9fbf508e23daf440
    Name           : updateInventory
    Kind           : Unspecified
    Start time     : 2023-01-27 16:35:28.779 +0000 UTC
    End time       : 2023-01-27 16:35:28.862282 +0000 UTC
    Status code    : Unset
    Status message :
Span #2
    Trace ID       : 0000000000000000550959aa7e5036ef
    Parent ID      : 419eda90943e0c03
    ID             : b381d2aea988a42c
    Name           : prepareOrderManifest
    Kind           : Unspecified
    Start time     : 2023-01-27 16:35:28.862 +0000 UTC
    End time       : 2023-01-27 16:35:28.872162 +0000 UTC
    Status code    : Unset
    Status message :
Span #3
    Trace ID       : 0000000000000000550959aa7e5036ef
    Parent ID      : fdbf8f7955900271
    ID             : 419eda90943e0c03
    Name           : receiveEvent
    Kind           : Unspecified
    Start time     : 2023-01-27 16:35:28.687 +0000 UTC
    End time       : 2023-01-27 16:35:28.873144 +0000 UTC
    Status code    : Unset
    Status message :
We can now confirm that the above traces are visible in Tempo:
Let me highlight once more the benefits from achieving deep observability:
In GetInData we know that already and now after reading this post you know it too.
In the second part of the observability series: ‘Observability on Grafana - lessons learned’ I will walk you through our insight from our use cases that we encountered and what we’ve learned like: how to choose reliable, feature rich tools able to support multiple architectures, or that configuration changes should be verified and applied automatically.
Businesses across industries are using advanced data analytics and machine learning to revolutionize how they operate. From detecting anomalies to…
Read moreIn the fast-paced world of data processing, efficiency and reliability are paramount. Apache Flink SQL offers powerful tools for handling batch and…
Read moreIntroduction As organizations increasingly adopt cloud-native technologies like Kubernetes, managing costs becomes a growing concern. With multiple…
Read moreMoney transfers from one account to another within one second, wherever you are? Volt.io is building the world’s first global real-time payment…
Read moreCustom components As we probably know, the biggest strength of Apache Nifi is the large amount of ready-to-use components. There are, of course…
Read moreThe rapid growth of electronic customer contact channels has led to an explosion of data, both financial and behavioral, generated in real-time. This…
Read moreTogether, we will select the best Big Data solutions for your organization and build a project that will have a real impact on your organization.
What did you find most impressive about GetInData?