Feature Store comparison: 4 Feature Stores - explained and compared
In this blog post, we will simply and clearly demonstrate the difference between 4 popular feature stores: Vertex AI Feature Store, FEAST, AWS…
Read moreDiscovering anomalies with remarkable accuracy, our deployed model successfully identified 90% true anomalies within a 2-months evaluation period. Dive in to find out how we used the historical data from all countries together to train a single generalizable model for each country and how we plan to enhance the model’s capabilities to pave the way for more robust anomaly detection.
Truecaller is a Swedish company founded in 2009 by Nami Zarringhalam and Alan Mamedi. The app began when the co-founders were just students who wanted to create a service that would easily identify incoming calls from unknown numbers.
Today, Truecaller is loved by over 338 million monthly active users around the world and is the go-to app for Caller ID, spam blocking and payments.
Truecaller is a leading global caller ID and call blocking app that is committed to building trust everywhere by making tomorrow's communication safer, smarter and more efficient by analyzing and executing decisions based on a massive amount of data. For this reason, from the very beginning, Truecaller preferred to remain a true data-driven company and, to achieve that, they needed to have access to the best data engineers and data scientists. This is why, for more than eight years, Truecaller has maintained a strategic partnership with GetInData. Within this long term partnership we have been able to support Truecaller’s data journey and solve the data science challenges they face. Our engineers are involved in all layers of the Truecaller data infrastructure, dealing with tasks related to event processing, through provisioning infrastructure for Machine Learning (ML), building ML models and deploying them to production.
This post presents one of the key ML-based services recently delivered by GetInData data scientists for Truecaller's Search, Spam, and Assets Business Unit - the Traffic Anomaly Detection Service. The service is responsible for daily analysis of the traffic that passes through one of Truecaller's crucial infrastructure components - the search service - and detecting anomalies in the traffic. To ensure the smooth operation of Truecaller, it is vital to detect any anomalies in the search service traffic as quickly as possible, as it may indicate serious problems with the infrastructure, such as a DoS attack or service unavailability. Each of these events may cause measurable losses for the business, not to mention a negative end-user experience.
The anomaly detection service is responsible for checking the traffic that hits the search service for abnormal flows. Examples of the abnormalities could be:
The main requirement for the anomaly detection service was high accuracy. Since alerts about anomalies are sent to the team's Slack channel and trigger a manual reaction, the frequency of false alarms must be minimized. That means the false positive ratio has to be as low as possible to avoid wasting people's time investigating the alerts.
A challenge that surfaced was the variation of traffic among different countries, which means that a certain level of traffic can be an anomaly in a country with high market penetration (e.g., India) while it can be considered normal in another. One could train a model for each country independently, but with limited historical data available, this was not an option, as our initial approaches revealed.
GetInData is a seasoned company when it comes to anomaly detection. There are already a bunch of customers for which such models were provided, nevertheless, as always in Data Science, each problem requires a bit of a different approach.
Three strategies were implemented and tested iteratively in the course of the project, where the last one was eventually successful:
The first approach was based on the Prophet library. Historical traffic data was used to train the Prophet model which was then used to forecast the future traffic. The forecasts were then compared with the observed traffic. In the case of bigger differences, an anomaly alert was triggered. The approach stood out with high recall but very poor precision, since the alerts were triggered almost everyday. As a consequence, the on-duty team stopped looking at those alerts very soon, because 99% of them were false.
The second approach seemed to be the most natural one, as it relied on harnessing an algorithm designed for the problem we had been facing. We started the research from the analysis of available algorithms for time-series anomaly detection based on an up-to-date survey paper(1). The case was defined as a univariate anomaly detection problem in a time-series stream, since we focused on detecting anomalies for a selected single metric at a particular moment.
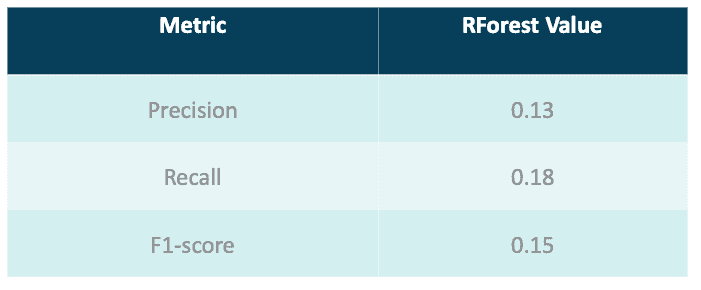
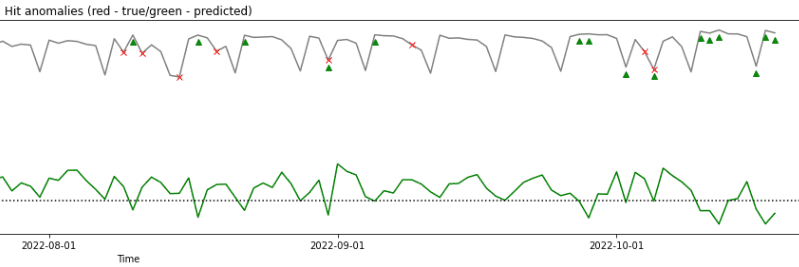
A few time series anomaly detection algorithms were tested, including GrammarViz(2), RForest(3), Sub-IF(4) and Half-Space Trees(5), where RForest yielded the best outcomes presented in Tab. 1. Unfortunately, the amount of identified anomalies was still too low, as shown in Fig. 1. Also, the algorithms yielded even poorer results in countries with lower market penetration (initial tests were conducted on the data from India, where Truecaller has the biggest number of active users).


The results shown in Tab. 1 and Fig. 1 demonstrate that time series anomaly detection algorithms performed poorly in our case, mostly due to limited data available as well as due to the fact that most of them are focused on detection of outliers which are not the only anomaly type we strive to detect.
The main conclusion drawn from the first two approaches was that for a single country there is not enough data to directly harness an ML algorithm to detect anomalies. As a consequence, the third approach to the project we started from the question: how can we use the historical data from all countries together to train a single generalizable model that could be then used to detect anomalies in traffic from a single country? This question naturally arose once we realized the aforementioned issues.
As the answer, we decided to apply z-standardization to all data points, with respect to the weekday, to capture the natural seasonality of the data. For each datapoint we calculated its z-score as:

where  is a four-weeks mean of the values for a specific weekday (e.g. mean value over last four Mondays), whereas
  is the standard deviation calculated in the same way.
After the z-standardization, we could put  values calculated for traffic data from all countries into a single training dataset, expanding its size by the number of countries for which we collected the data (20). This dataset, however, was no longer a time-series dataset, but a set of independent points, out of which some were anomalous and most (~98%) were normal. We could therefore resign from complex time-series classification algorithms, in favor of ordinary ones such as SVM or Random Forest.
We labeled the data semi-manually, with support of LabelStudio, and then applied boosting and sub-sampling techniques in order to make the dataset more balanced in terms of positive and negative case presence. Next, we tried to train the three most common classification algorithms: SVM, Random Forest and Logistic Regression using the standard cross-validation method. The results are summarized in Tab. 2. In order to ensure that the obtained results are generalizable for specific countries, besides the standard CV procedure, we also tested the best model (Random Forest) on unseen data for specific countries only. In Tab. 3 we show the results for two example countries - India and Egypt.


Fig. 2 presents an example traffic graph, with anomalies detected by the described approach (similar to Fig. 1).

The achieved results were surprisingly good, hence the decision was made to deploy the last model to production for evaluation.
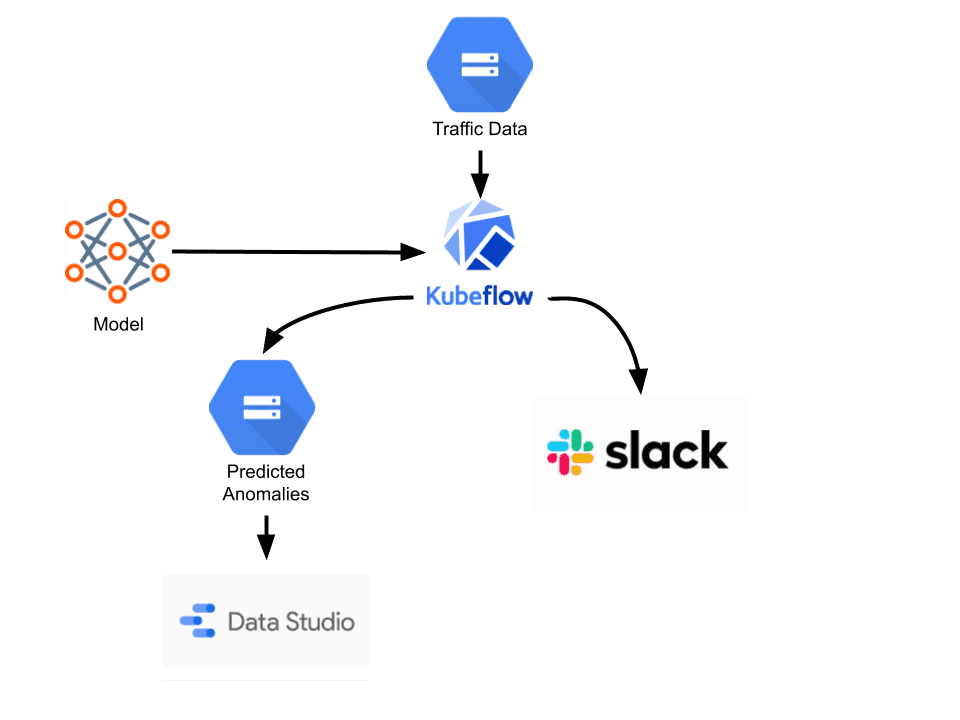
Our MLOps specialists recommended the most up-to-date tech stack for deploying the model on production, which was already set up in Truecaller’s infrastructure and started to be used by other teams at Truecaller. The model was implemented using the Kedro framework, and triggered as a Kubeflow pipeline from an Airflow DAG. Kedro was used as a skeleton for the data science code structuring, while Kubeflow was an execution platform. The whole process of detection anomalies was scheduled from an Airflow DAG when the necessary traffic data was ready. The whole pipeline is shown in Fig. 3.

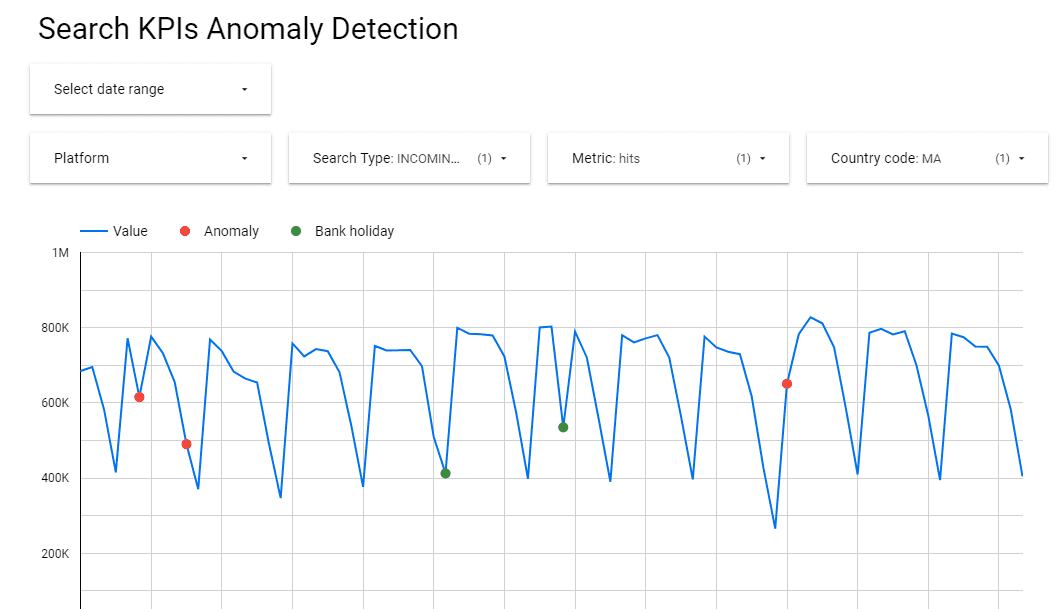
The anomalies predicted by the pipeline are output to a Slack channel in order to immediately notify the on-duty team, and saved to a datastore to be later visualized in Looker Data Studio. Visualization in Data Studio helps the on-duty team to see an anomaly in the context of the traffic that precedes its occurrence. A screenshot from Data Studio is shown in Fig. 4.

The deployed machine learning model performed well in production, triggering 90% true anomalies in the period of evaluation (two months). The false anomalies were observed around holiday periods (e.g. Christmas, New Year’s Eve), when the traffic was generally lower due to more people taking free days and did not match the patterns learned by the model. One of the future improvements of the model is therefore to include features describing not only the weekly seasonality (as it is done now) but also yearly. This is, however, more challenging since bank holidays are different across different countries, thus such features would have to be incorporated to the results returned by the country-independent model.
Another drawback of the solution is the fact that data labeling was done mostly manually and therefore the model is trained to detect anomalies of the types observed in the limited time period. Though data was taken over a period of 6 months for 10 different countries, it is still uncertain whether all types of anomalies were captured sufficiently. In the future we therefore plan to periodically re-train the model, incorporating feedback about correctness of the detected anomalies from the on-duty team.
The anomaly detection model helps Truecaller to identify various issues/abnormalities that would otherwise have been detected days or weeks later. It helps them to act quickly and decipher search patterns across various markets with trusted data points. Additionally, the dashboards and Slack alerts make it accessible to product stakeholders, enabling them to react quickly.
In this blog post we dived into the Traffic Anomaly Detection Service developed by GetInData and Truecaller's data scientist team. With the crucial task of analyzing the daily traffic flowing through Truecaller's search service, this ML model plays a vital role in swiftly identifying anomalies that could signal critical issues in the infrastructure, such as DoS attacks or service unavailability. By detecting these anomalies promptly, Truecaller can minimize potential losses and ensure a positive user experience.
If you want to know more about the model or discuss your needs in the case of a machine learning model, sign up for a free consultation with our experts.
Bibliography
In this blog post, we will simply and clearly demonstrate the difference between 4 popular feature stores: Vertex AI Feature Store, FEAST, AWS…
Read moreRecently I’ve had an opportunity to configure CDH 5.14 Hadoop cluster of one of GetInData’s customers to make it possible to use Hive on Spark…
Read moreData Studio is a reporting tool that comes along with other Google Cloud Platform products to bring out a simple yet reliable BI platform. There are…
Read moreKnowledge sharing is one of our main missions. We regularly speak at international conferences, we contribute to open-source technologies, organize…
Read moreIn today's data-driven world, maintaining the quality and integrity of your data is paramount. Ensuring that organizations' datasets are accurate…
Read moreWith the introduction of ChatGPT, Large Language Models (LLMs) have become without doubt the hottest topic in AI and it doesn’t seem that this is…
Read moreTogether, we will select the best Big Data solutions for your organization and build a project that will have a real impact on your organization.
What did you find most impressive about GetInData?